


Central banks moving closer towards easing, plus S&P 500 w/o a 2% decline, Sahm rule, and corporate taxes
The Sandbox Daily (6.24.2024)

Welcome, Sandbox friends.
Nvidia and bitcoin are sliding hard, Wikileaks co-founder Julian Assange will plead guilty to leaking U.S. national security secrets and return to his native Australia, and TikTok confirms it offered the U.S. government a 'kill switch' back in 2022.
Today’s Daily discusses:
moving closer to net accommodation
S&P 500 streaks without 2% declines
Sahm rule may be just a few months away from triggering
corporate taxes in the context of the upcoming election season
Let’s dig in.
Markets in review
EQUITIES: Dow +0.67% | Russell 2000 +0.43% | S&P 500 -0.31% | Nasdaq 100 -1.15%
FIXED INCOME: Barclays Agg Bond +0.08% | High Yield -0.10% | 2yr UST 4.721% | 10yr UST 4.232%
COMMODITIES: Brent Crude +0.96% to $86.06/barrel. Gold +0.64% to $2,346.1/oz.
BITCOIN: -7.53% to $59,158
US DOLLAR INDEX: -0.31% to 105.468
CBOE EQUITY PUT/CALL RATIO: 0.63
VIX: +0.98% to 13.33
Quote of the day
“Change, although it involves risks, is the law of life.”
- Bobby Kennedy
Moving closer to net accommodation
This month, the European Central Bank (ECB) and the Bank of Canada (BoC) cut their target interest rates for the 1st time since the pandemic. These two developed market central banks join Sweden’s Riksbank and the Swiss National Bank, as well as a handful of emerging market central banks, in commencing monetary policy pivots toward easing.
The share of the world’s central banks in easing cycles has now climbed to 41%, the highest since March 2022.
As shown in the cutout table in the chart below, when more than half of the world’s central banks are in easing cycles, it’s historically been a bullish condition for global equities.

What’s more, it’s been over 8 weeks since the last central bank raised a target interest rate at their most recent meeting, which is down from the peak of 85.3% in September 2022. See the middle pane below.

The resiliency in the global economy has been surprising considering the surge in interest rates.
Source: Ned Davis Research, Macro Alf
S&P 500 streaks without 2% declines
Today was the 335th consecutive trading day without a 1-day market drop of at least 2%, with the last ugly red candle occurring February 21, 2023.
This is significantly above the average length of 29 days before a -2% day.
While the current streak is only about a third as long as the longest on record (949 days from May 2003 to February 2007), if we get to July 17th without a 1-day selloff of 2%+, this will be the longest streak since pre-GFC.

While the headline index has seen a very long stretch without a 2% down day, under the surface it is a different story.
Looking at the number of individual stocks with -2% daily moves, we are trending above average.

So, what is causing this air pocket in downside volatility?
“At a high level, the clouds of macro uncertainty have parted over the last 12 months as receding inflation provided much-needed clarity into the future path of monetary policy,” said Adam Turnquist, Chief Technical Strategist at LPL Financial.
″The changing narrative from rate hikes to rate cuts and recessions to economic resilience helped drag the VIX down to multiyear lows, ultimately shifting the backdrop for stocks to a low volatility from high volatility regime.”
Source: Bespoke Investment Group, Piper Sandler, CNBC
Sahm rule may be just a few months away from triggering
Despite unemployment being a lagging indicator, it’s important to note that when it inflects meaningfully upward off the lows, it has been a sign of worse things to come.
Headline unemployment has climbed from 3.4% to 4.0%, but so far it’s gaining too slowly to give a Sahm Rule recession signal.

The Sahm Recession Indicator signals the start of a recession when the 3-month moving average of the national unemployment rate rises by 0.50 percentage points or more relative to the minimum of the 3-month averages from the previous 12 months.
This closely watched labor market recession indicator, the Sahm rule, has been slowly ticking higher in 2024.
Currently at 0.37, if we see unemployment at one or two tenths higher for a few months, this indicator would hit 0.50 and trigger a recession warning, which could alarm investors and cause the Fed to respond quickly given their dual mandate to target stable prices and full employment.

Source: J.P. Morgan Markets
Corporate taxes in the context of the upcoming election season
As the presidential debate season kicks off, the current and former presidents’ divergent approaches to taxes will be on display. Naturally, this is a controversial topic fueled by strong political views on our nation’s priorities, government spending, entitlement programs, fairness around taxation, and much more.
Investors often focus on corporate tax rates because they can directly affect the profitability of large companies and thus their share prices. However, tax rates and the nation’s philosophy around taxes have both fluctuated throughout history.
As the chart below shows, corporate and individual tax rates were higher for much of the 20th century before declining during the Reagan era. Some expect taxes to rise in the future due to the size of the budget deficit.
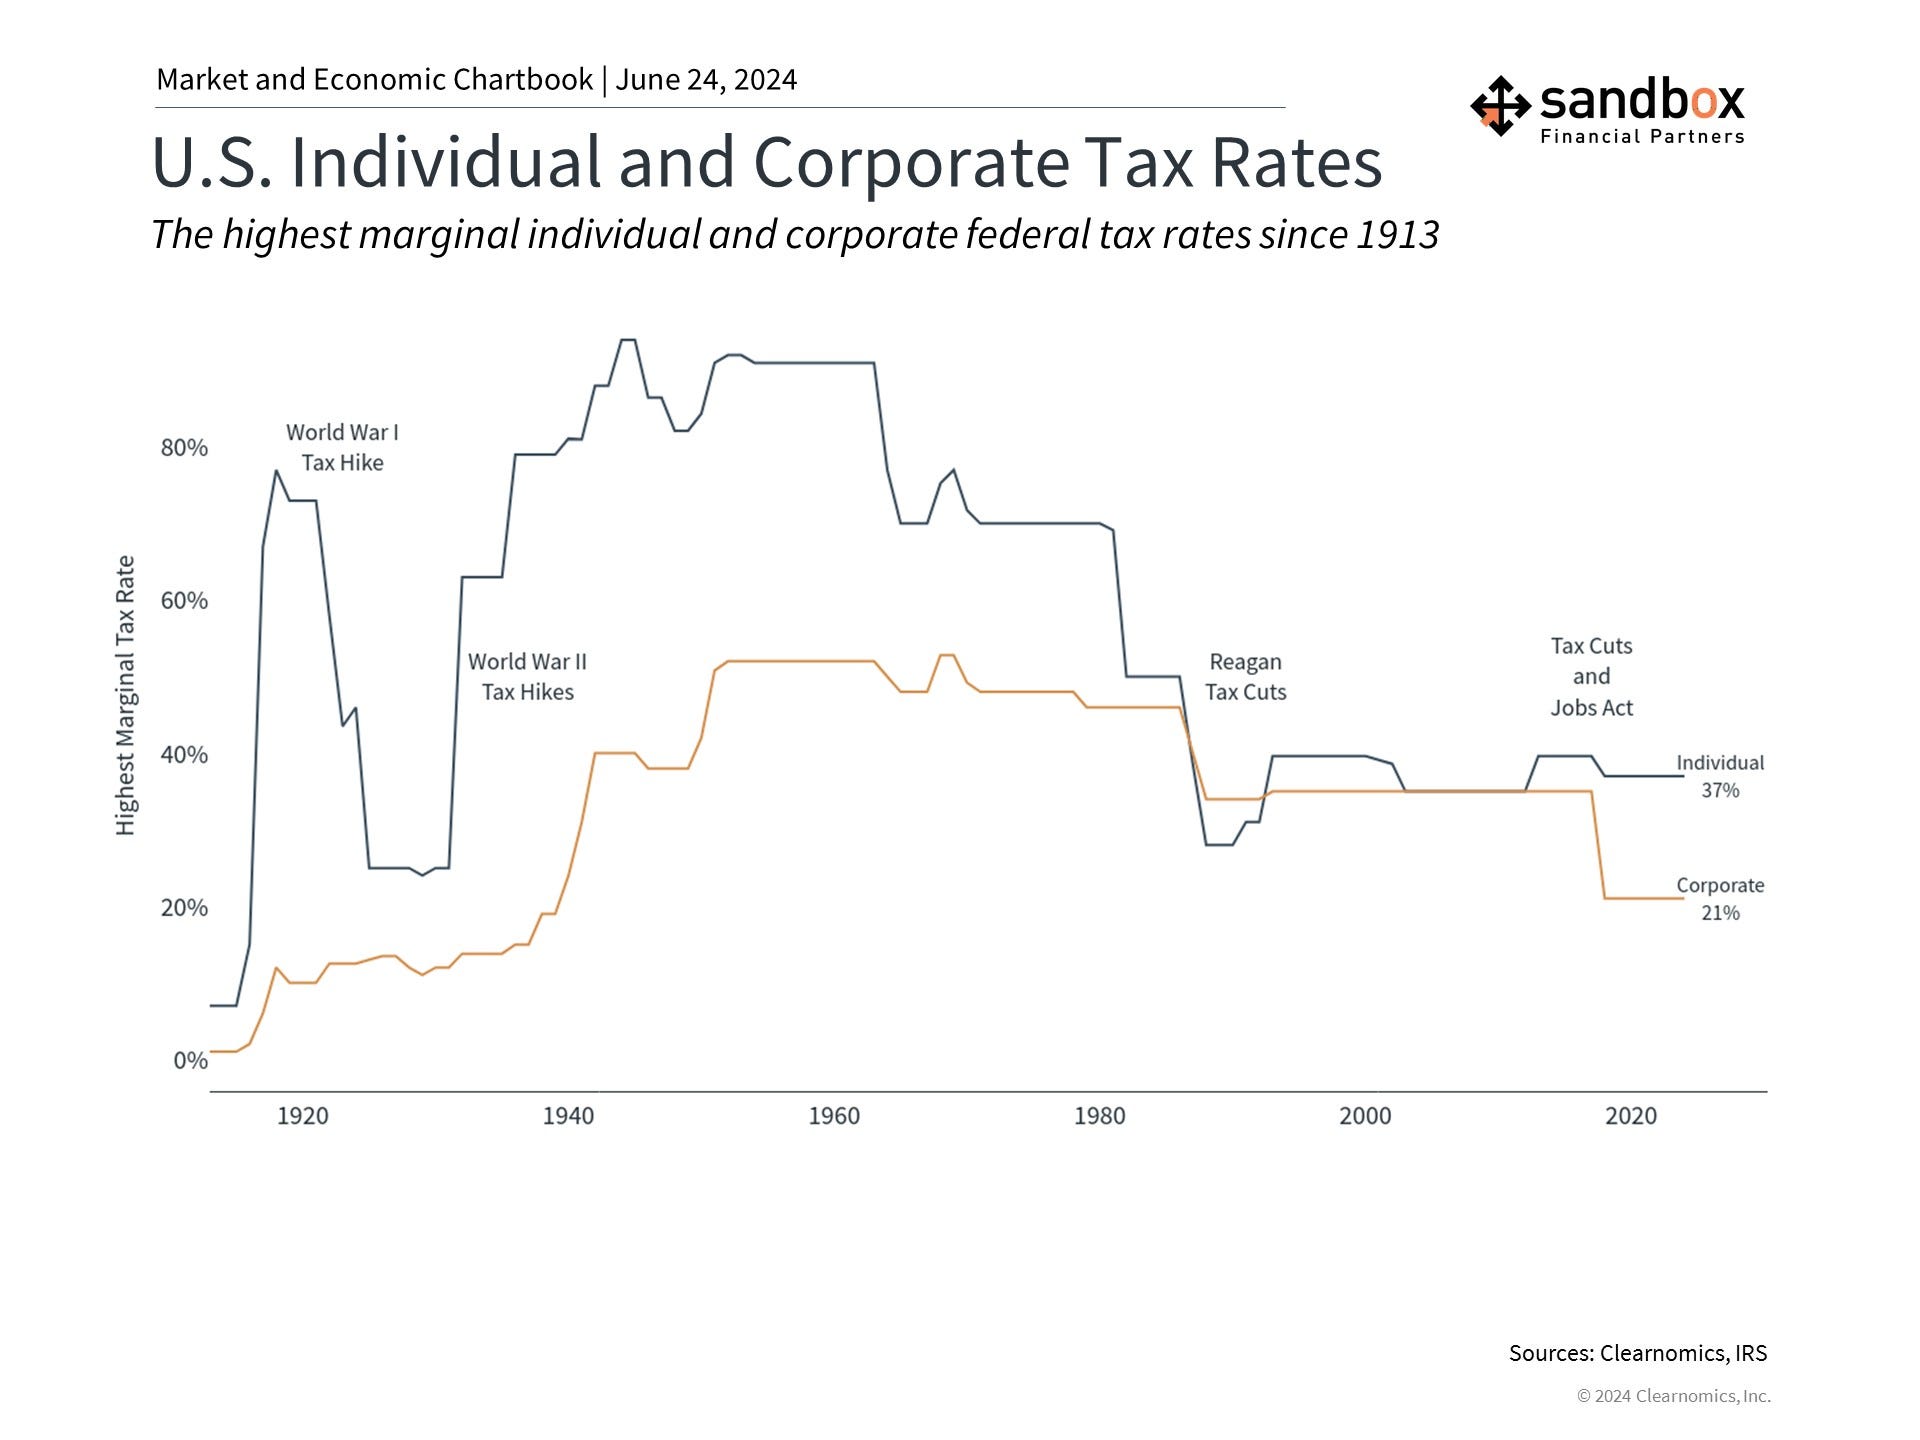
The stereotype of each party is that Republicans favor lower taxes while Democrats support higher rates, particularly for corporate income taxes. Of course, the exact priorities and proposals of each party have evolved over the decades, especially around balancing the budget.
The cornerstone of former President Trump’s tax policy was the 2017 Tax Cuts and Jobs Act, which reduced the corporate tax rate from 35% to 21%. To put that in context, the U.S. previously had the highest corporate tax rate of any OECD country, and the reduction puts us just below the OECD average. The corporate tax rate peaked at 52.8% in the late 1960s, although changing tax brackets make historical corporate tax comparisons challenging. Also, what corporations actually pay can differ significantly from statutory rates.
The share of revenue from corporate taxes has declined dramatically from 27% in 1950 to just 9.4% today. In contrast, individual income taxes have remained an important share of government receipts, growing from 40% to 49% over the same period.

Thus, although corporate taxes receive significant attention from investors, the reality is that they make up a relatively small fraction of total tax revenues today.
Source: Clearnomics
That’s all for today.
Blake
Welcome to The Sandbox Daily, a daily curation of relevant research at the intersection of markets, economics, and lifestyle. We are committed to delivering high-quality and timely content to help investors make sense of capital markets.
Blake Millard is the Director of Investments at Sandbox Financial Partners, a Registered Investment Advisor. All opinions expressed here are solely his opinion and do not express or reflect the opinion of Sandbox Financial Partners. This Substack channel is for informational purposes only and should not be construed as investment advice. The information and opinions provided within should not be taken as specific advice on the merits of any investment decision by the reader. Investors should conduct their own due diligence regarding the prospects of any security discussed herein based on such investors’ own review of publicly available information. Clients of Sandbox Financial Partners may maintain positions in the markets, indexes, corporations, and/or securities discussed within The Sandbox Daily. Any projections, market outlooks, or estimates stated here are forward looking statements and are inherently unreliable; they are based upon certain assumptions and should not be construed to be indicative of the actual events that will occur.