Historical context of the current bull market, plus earnings report card and personal savings
The Sandbox Daily (10.23.2024)
Welcome, Sandbox friends.
Today’s Daily discusses:
historical context of current bull run
early report card on Q3 earnings season
personal savings rate leaves much to be desired
Let’s dig in.
Markets in review
EQUITIES: Russell 2000 -0.79% | S&P 500 -0.92% | Dow -0.96% | Nasdaq 100 -1.55%
FIXED INCOME: Barclays Agg Bond -0.25% | High Yield -0.30% | 2yr UST 4.082% | 10yr UST 4.244%
COMMODITIES: Brent Crude -1.10% to $75.20/barrel. Gold -1.15% to $2,728.4/oz.
BITCOIN: -1.26% to $66,487
US DOLLAR INDEX: +0.31% to 104.393
CBOE EQUITY PUT/CALL RATIO: 0.59
VIX: +5.71% to 19.24
Quote of the day
“If you don't like the road you're walking, start paving another one.”
- Dolly Parton
Historical context of current bull run
The old Wall Street adage “markets climb a wall of worry" sums up the narrative of this market quite well.
Equity markets have managed to maintain a steady upward path despite dozens of roadblocks, some of which include rising interest rates, an upward inflationary spiral, geopolitics, and recession.
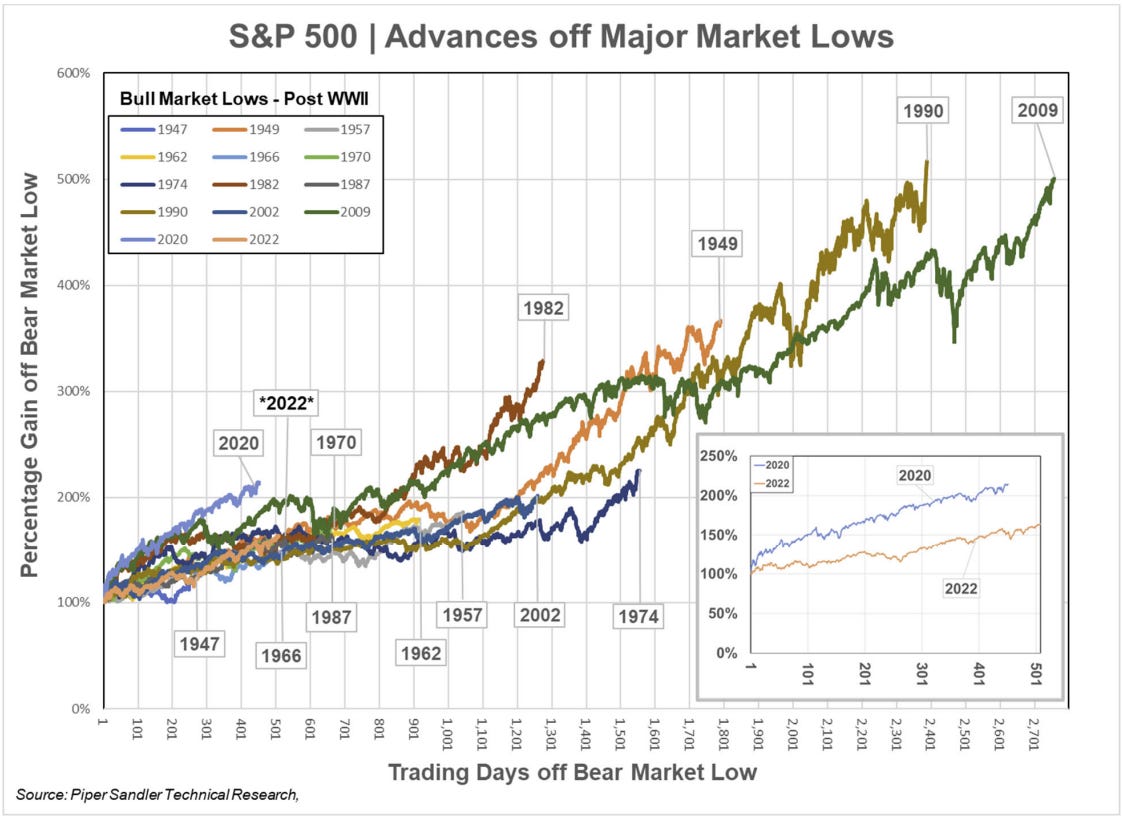
As we enter year three of the bull market off the October 2022 lows, the path forward shows risks are tilted to the upside given the context of well-telegraphed monetary policy from central banks around the world, lower borrowing costs, and an expansion in the corporate earnings cycle.
Historically, advances off bull market cyclical lows have an average duration of 1,147 trading days. Today, the current bull is just 507 trading days old – less than half the average advance post-World War II.
Source: Piper Sandler
Early report card on Q3 earnings season
With ~20% of S&P 500 earnings in the bank, early reporting from 3rd quarter earnings season shows corporate America has delivered solid numbers thus far (FactSet projects +3.4% YoY earnings growth vs. the current blended EPS growth is +3.2%), and the beating stocks have responded with their best gains in years.
This is a positive sign of a healthy financial market, especially when the major indexes are trading near all-time highs and positioning is elevated.
As we enter the busiest weeks of reporting season (~60% of the S&P 500 is scheduled to report this week and next), much has been made of the steady degradation of earnings expectations by sell-side analysts – effectively creating a lower hurdle rate to clear – over the last 3-4 months after expectations peaked in June.
Unfortunately, this is business as usual on Wall Street.
Point, counterpoint.
Where are the earnings coming from?
It’s still a story of the have and have nots.
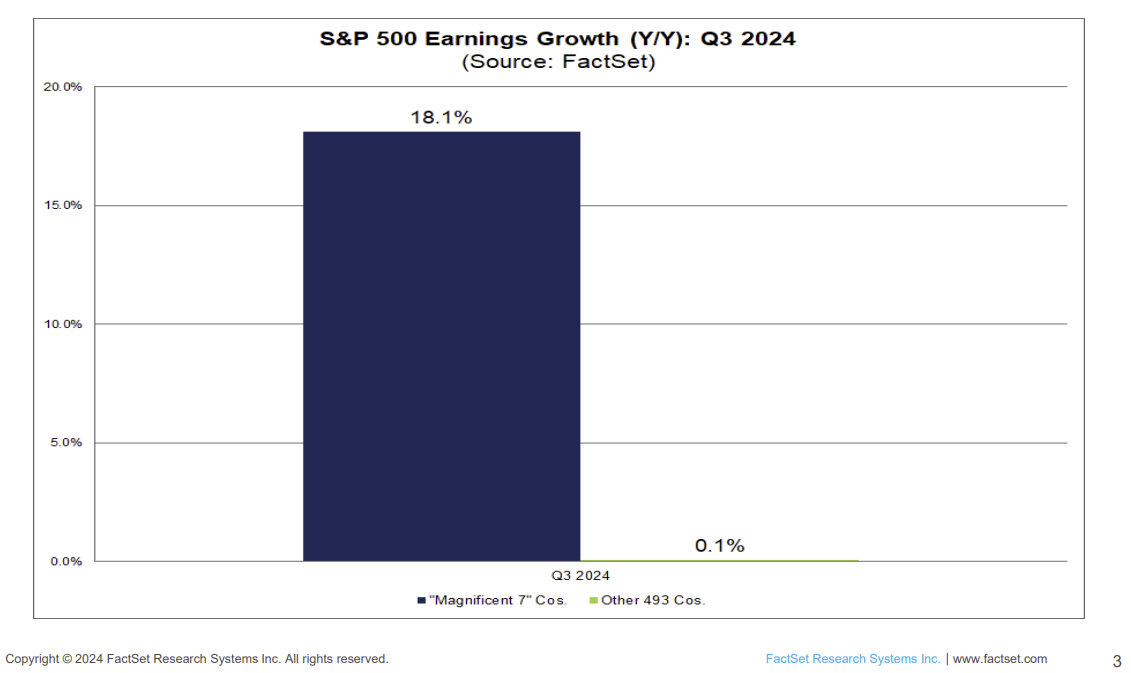
The Magnificent 7 is forecasted to print +18.1% YoY earnings growth, which sounds great until you consider it was +36% just last quarter.
Meanwhile, the S&P 493 (or “ex-Mag 7”) earnings are expected to rise just +0.1%.
After driving much of the earnings over the past year, analysts predict the Mag 7 earnings story will normalize in the coming quarters as the baton is passed to the broader market, which should continue to underpin the breadth expansion we’ve seen since the summer.
Looking ahead, the mutual fund tax-related selling peak will end on/around Halloween. Add in the return of corporate stock repurchase activity and the end of U.S. election uncertainty, and the public stock markets could be looking forward to a strong year-end rally.
Ryan Detrick notes there is precedent for continued strength in the market based on the catalogue of the historical record. When the market rips consistently higher (up 10 of 11 months), the market is higher on average over the next 3 months, 6 months, and 12 months.
Headwinds for the bulls will be higher market valuations and continued strength in the economic data leading to questions over the future path of Fed rate cuts.
Source: FactSet, J.P. Morgan Markets, Ryan Detrick, CMT
Savings rate leaves much to be desired
The consumer continues to show resiliency despite the naysayers, with aggregate household balance sheets still strong as evidenced by retirement account performance, net worth-to-disposable income, and household home equity measures.
One area that remains a black eye is the Personal Savings Rate, which hovers around 5% – below pre-covid levels and the vast majority of the post-1980 modern period.
A low Personal Savings Rate leaves household spending susceptible to negative economic shocks.
Source: Goldman Sachs Global Investment Research
That’s all for today.
Blake
Questions about your financial goals or future?
Connect with a Sandbox financial advisor – our team is here to support you every step of the way!
Welcome to The Sandbox Daily, a daily curation of relevant research at the intersection of markets, economics, and lifestyle. We are committed to delivering high-quality and timely content to help investors make sense of capital markets.
Blake Millard is the Director of Investments at Sandbox Financial Partners, a Registered Investment Advisor. All opinions expressed here are solely his opinion and do not express or reflect the opinion of Sandbox Financial Partners. This Substack channel is for informational purposes only and should not be construed as investment advice. The information and opinions provided within should not be taken as specific advice on the merits of any investment decision by the reader. Investors should conduct their own due diligence regarding the prospects of any security discussed herein based on such investors’ own review of publicly available information. Clients of Sandbox Financial Partners may maintain positions in the markets, indexes, corporations, and/or securities discussed within The Sandbox Daily. Any projections, market outlooks, or estimates stated here are forward looking statements and are inherently unreliable; they are based upon certain assumptions and should not be construed to be indicative of the actual events that will occur.
Please see additional disclosures at the Sandbox Financial Partners website:


