State of the Markets: bringing clarity to this messy environment
The Sandbox Daily (5.14.2024)
Welcome, Sandbox friends.
Today’s Daily discusses:
guest spot on the All Star Charts podcast
state of the market: making sense of this messy environment
Let’s dig in.
Markets in review
EQUITIES: Russell 2000 +1.14% | Nasdaq 100 +0.68% | S&P 500 +0.48% | Dow +0.32%
FIXED INCOME: Barclays Agg Bond +0.27% | High Yield +0.16% | 2yr UST 4.821% | 10yr UST 4.445%
COMMODITIES: Brent Crude -0.84% to $82.66/barrel. Gold +0.82% to $2,362.2/oz.
BITCOIN: -2.56% to $61,561
US DOLLAR INDEX: -0.20% to 105.012
CBOE EQUITY PUT/CALL RATIO: 0.57
VIX: -1.32% to 13.42
Quote of the day
“Strong leaders engage their critics and make themselves stronger. Weak leaders silence their critics and make themselves weaker.”
- Adam Grant, Author of Think Again
Guest spot with All Star Charts on The Morning Show podcast
This morning, I joined my friends J.C. Parets, Steve Strazza, and Spencer Israel from All Star Charts on The Morning Show, where we discussed meme stocks, equity markets, volatility, inflation, yields, 2nd half market risks, and much more. I come in at the 28:30 mark – check it out!
All Star Charts is a leading Technical Analysis research platform catering to hedge funds, institutional investors, RIAs, traders, and everyone in between. If you are a market technician or an investor interested in ripping through thousands of charts with thoughtful perspectives layered on top, give them a visit at their website.
State of the markets – making sense of this messy environment
With markets anxious about stubborn inflation, multiple geopolitical conflicts, and the timing of the 1st interest rate cut from the Federal Reserve, it’s no surprise that investors are feeling grey in this messy and uncertain macro environment. There is no shortage of scary headlines or doomsayers that further instill a general lack of confidence or clarity. After suffering through twin stock market drawdowns in 2020 and 2022, investors are rightfully skeptical to question if these gains can hold.
The good news?
Many major stock market averages are at/near/approaching all-time highs or 52-week highs, home prices (and the embedded equity) are higher than ever before, the median net worth for the typical U.S. household is at the highest on record, and the economy continues to click along at trend growth.
Greenshoots are everywhere, and I’d like to discuss some that are top of mind.
But first, let’s start with some context. As in, why did we start May in fear?
There have been a number of developments that transpired throughout the 1st part of the year creating the general sense of malaise that plagues investors today.
The disinflation path has stalled out, with the “last mile” proving more difficult than many expected. The Fed has acknowledged as much. Hawks are taking that as inflation is reaccelerating, but that’s not my view. We all know about the stale rent data, used cars, and insurance – these statistical aberrations continue to plague this data series. Inflation should improve from here once the hard data catches up to the soft data.
Because of sticky high inflation, interest rates have moved up. The 10-yr climbed from 3.9% (January 2) to 4.7% (April 25) as the market priced out 5-6 interest rate cuts in 2024. And, of course, equities don’t like that.
We also know that stocks rallied for 5 months off the October 2023 lows, returning ~30% depending on the index. A 5% pullback in April had many bears fearing the top was in for 2024. But we know this “correction” in April is perfectly normal; as Ryan Detrick notes in the chart below, 5% pullbacks are shallow and quite frequent.
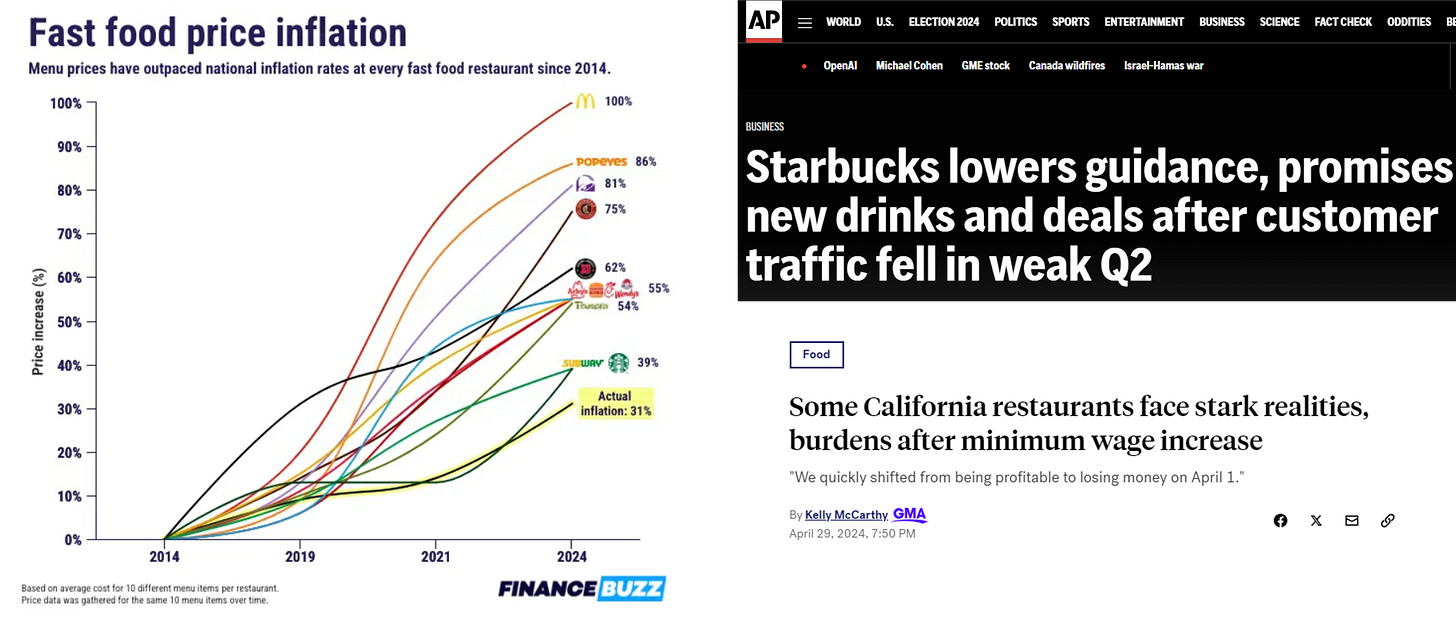
The 1st quarter earnings season, nearly complete, showed many companies are facing a profit squeeze. Wages have been creeping up for a few years now. Companies that were aggressive with price increases are seeing traffic shortfalls or tradedowns. Both pose real headwinds to a company’s bottom line.
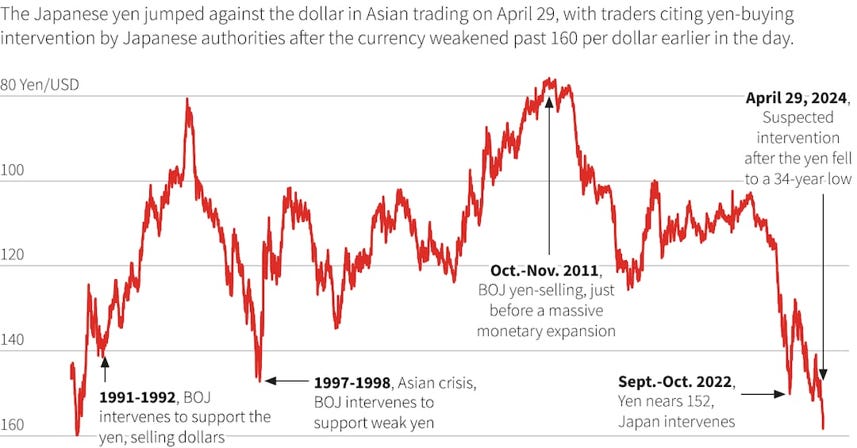
The Japanese Yen needed two interventions from the Bank of Japan; currency intervention is just one of those things that scares investors. A historically important currency like the Japanese Yen remaining highly volatile and reaching multi-decade lows relative to many other major currencies does not instill confidence, either.
And finally, after a choppy April, we turned the calendar forward to May and arrived at the old market maxim “sell in May and go away”. As we know, this seasonal pattern is based on stocks' historical underperformance during the 6-month period from May to October. Indeed, the next 6 months (May to October) are the worst possible 6-month combination of the calendar year.
One can go on and on building the bear case.
BUT, as we stated at the top, there are far too many greenshoots to ignore. Simply calling a top or labeling this market broken does not give this resilient economy and durable market a fair shake.
To wit…
The Fed is “dovish” relative to consensus market expectations. Jerome Powell dismissed the idea of hikes, an important discharge of the groundswell of voices calling for hikes over the last few months. What’s more, he also strongly dismissed the idea of stagflation. Chair Powell stated the FOMC sees two main paths for the committee to consider rate cuts: 1) inflation moving sustainably down to 2% and 2) unexpected softening in the labor market. And finally, by slowing Quantitative Tightening (QT), or balance sheet runoff, the Fed effectively made a dovish pivot. It doesn’t want rates to run up and it doesn’t want a liquidity problem. Bottom line: the Fed titled incrementally dovish in the last Fed meeting.
The economy no longer seems “red hot.” Looking specifically at the strongest segment of the economy, we had a softer April jobs report (smallest gain in 6 months), while the March JOLTS report showed job openings across America continued its gradual 2-year descent lower and currently sits at a 3-year low. More slack in the labor market is good right now. The durability of this labor market cannot be understated: April marked the 40th consecutive month of job gains, We are adding jobs well above the pre-pandemic trend, and April marked the 29th consecutive month that the nation’s jobless rate has been at or below 4% (the longest stretch in more than 50 years).
With macro uncertainty weighing on sentiment, investors are more focused on this corporate earnings season than usual. We’ve now heard from 92% of S&P 500 companies this earnings season. Of the companies that have already reported, 81% of companies have delivered an earnings beat which is better than the 10-year average of 73%. The blended earnings growth rate is coming in around 5.9% year-over-year, the highest in almost two years and making this the 3rd straight quarter of earnings growth. Wall Street analysts are expecting +10.2% growth in earnings this year, +14.0% in 2025 and +11.7% in 2026. Remember, stock prices over time follow the direction of earnings.
April market declines alleviated “overbought” conditions, resetting the risk/reward.
Investors de-leveraged in April. It is important to recognize that the NAAIM Exposure Index is not predictive in nature and is of little value in attempting to determine what the stock market will do in the future. The primary goal of most active managers is to manage the risk/reward relationship of the stock market and to stay in tune with what the market is doing at any given time. As such, the NAAIM Exposure Index provides insight into the actual adjustments active risk managers have made to client accounts. As you can see, there was a stead and major whoosh lower from late March (103.88) to the nadir around late April/early May (59.48).
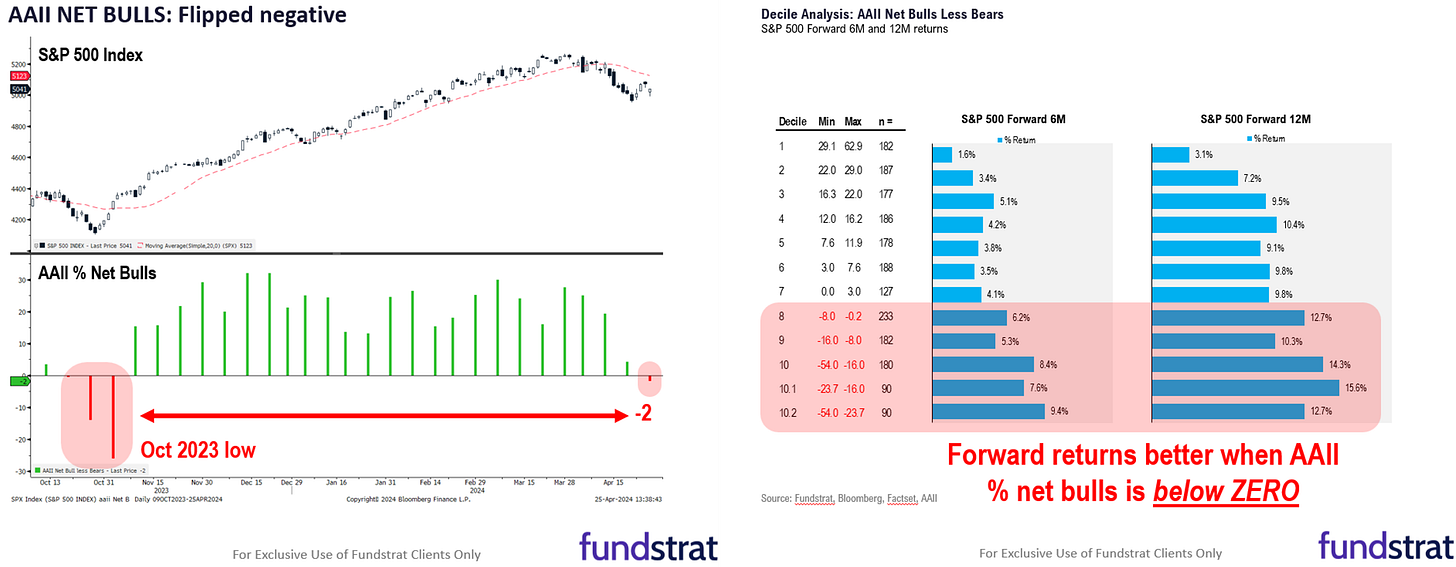
Sentiment flipped negative = positive for markets.
Volatility has collapsed. The VVIX index (volatility of volatility) just made its lowest close in about 8 years. The demand for tail risk hedging has evaporated as investors feel more secure.
And we can see credit markets are confirming what has transpired in the stock market. U.S. corporate bond spreads are very close to 15 years lows.
Perhaps most bullish of all? You can’t have a bull market without bulls, or new highs, for that matter. That’s why market technicians look beneath the surface for signs of market health. The advance-decline (A/D) line is a classic breadth indicator, measuring the number of advancing issues against the number of stocks that declined on the day. Check out the New York Stock Exchange advance-decline line (lower pane) making new record highs. As breadth expands, one can expect price to follow next.
Tomorrow, we get our next inflation read with the arrival of the Consumer Price Index (CPI) report for April. The importance of this data release cannot be overstated. It may just shape what we see from markets over the next few weeks and months. More to come, to be sure!
For now, thanks for tuning into this State of the Markets that ran much greater in length than normal. We appreciate your readership!!
That’s all for today.
Blake
Welcome to The Sandbox Daily, a daily curation of relevant research at the intersection of markets, economics, and lifestyle. We are committed to delivering high-quality and timely content to help investors make sense of capital markets.
Blake Millard is the Director of Investments at Sandbox Financial Partners, a Registered Investment Advisor. All opinions expressed here are solely his opinion and do not express or reflect the opinion of Sandbox Financial Partners. This Substack channel is for informational purposes only and should not be construed as investment advice. The information and opinions provided within should not be taken as specific advice on the merits of any investment decision by the reader. Investors should conduct their own due diligence regarding the prospects of any security discussed herein based on such investors’ own review of publicly available information. Clients of Sandbox Financial Partners may maintain positions in the markets, indexes, corporations, and/or securities discussed within The Sandbox Daily. Any projections, market outlooks, or estimates stated here are forward looking statements and are inherently unreliable; they are based upon certain assumptions and should not be construed to be indicative of the actual events that will occur.


