Unpacking 2022 market performance
The Sandbox Daily (1.3.2023)
Welcome back, Sandbox friends.
Hopefully everyone had a wonderful holiday season. Happy New Year and cheers to a healthy, happy, and prosperous 2023.
Today’s Daily discusses market performance in 2022.
It was exactly a year ago — January 3rd, 2022 — when the S&P 500 peaked out at its all-time high, hitting a record close of nearly 4,796. Today we closed at 3,824, or down -20.3% from the high watermark.
Let’s dig in.
Markets in review
EQUITIES: Dow -0.03% | S&P 500 -0.40% | Russell 2000 -0.60% | Nasdaq 100 -0.70%
FIXED INCOME: Barclays Agg Bond +0.59% | High Yield +0.19% | 2yr UST 4.382% | 10yr UST 3.758%
COMMODITIES: Brent Crude -4.02% to $82.46/barrel. Gold +0.99% to $1,844.4/oz.
BITCOIN: -0.23% to $16,678
US DOLLAR INDEX: +1.09% to 104.651
CBOE EQUITY PUT/CALL RATIO: 0.84
VIX: +5.68% to 22.90
Historical context for the 60-40 portfolio
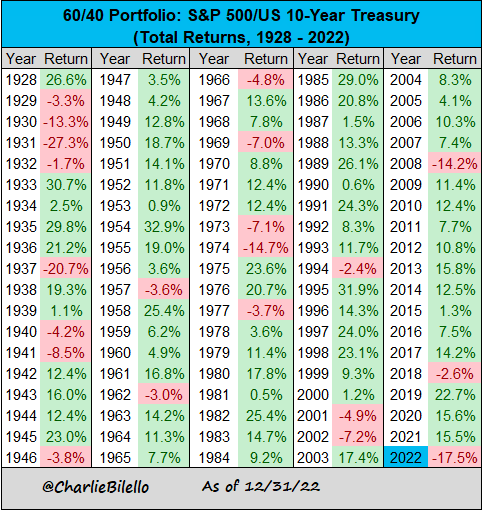
A 60-40 portfolio of U.S. stocks-bonds was down -17.5% in 2022, its worst year since 1937 and 3rd worst in history.1
Perhaps an easier visual representation is to apply bar charts so we can see how uniquely bad 2022 was for portfolio returns. By stacking the equity and bond returns together, we also decompose how the 60-40 return was generated each calendar year since 1950.2
Since the inception of the Bloomberg U.S. Aggregate Bond Index (1976), the S&P 500 and the Agg have never been negative in the same year. Not only did that happen last year, it was also the 3rd worst year for stocks (2002 and 2008 were more negative) and the worst year for the Agg.
Source: Charlie Bilello, J.P. Morgan Asset Management
U.S. stock market winners and losers of 2022
The markets in 2022 were characterized by a lot more pain than gain.
All around the world, central banks raised interest rates for the first time in years to stomp out surging inflation. The Russian invasion of Ukraine and China’s draconian Covid-zero policies threw markets and supply chains into further disarray. Other headwinds formed – an energy shock, a strong U.S. dollar, a softening consumer, slowing money supply, and corporate cost-cutting initiatives including layoffs – to name a few.
The S&P 500 fell -19.4% in 2022, coming just shy of the -20% mark that only 6 other years since 1928 have seen. Here’s a look at every annual price change for the S&P 500 since 1928, grouped into 10 percentage point intervals. Last year was tough but much better versus the worst years in history.
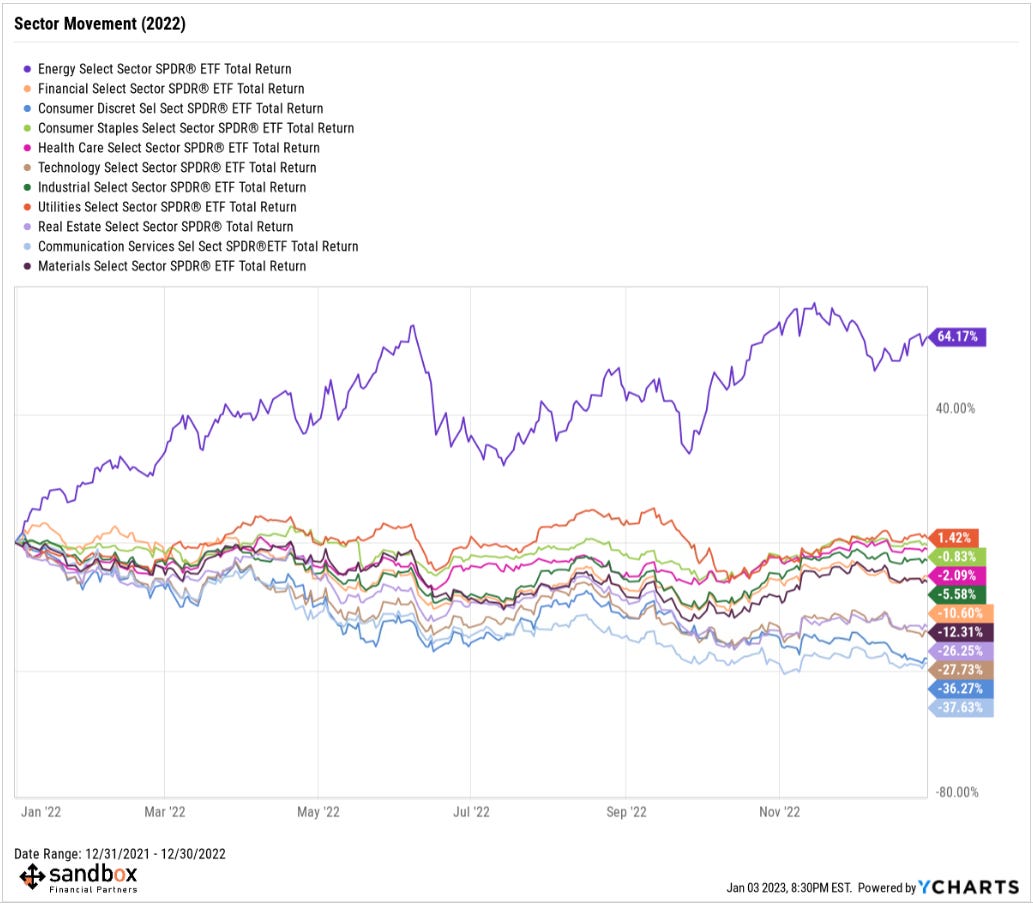
The winners won big in 2022, both in absolute terms and on a relative basis. These include typical sectors that outperform in difficult markets (utilities, consumer staples, and health care), as well as strength from the energy complex (now up +152% over the last 24 months) despite falling oil prices in the back half of the year.
The losers? Well… there were many. Stocks (and bonds) were both overvalued coming into 2022, but the speed and magnitude of central bank rate hikes – none more important than the Federal Reserve – shows how badly the market was caught offside.
Here is a heatmap of the U.S. stock market.
Source: Bespoke Investment Group, Visual Capitalist
Back-to-back down years are rare for the S&P 500
2022 was the worst year for the S&P 500 since 2008 and the 4th worst year since the index was expanded to 500 companies in 1957.
Historically, back-to-back down years are a very rare occurrence. The S&P 500 has only seen consecutive years of negative returns 3 times since 1957, in 1973/1974 and in 2001/2002/2003 with returns getting worse in the second (and third) down year on each of those occasions.
Since 1957, the S&P 500 has ended the year in the red 18 times including 2022. On 14 occasions, the index returned to growth the next year. What’s in store for 2023?
Source: Statista
Bonds uncharacteristic year
The final results for a year unlike any other in the history of the bond market – one line is not like the other.
Steep losses were suffered in nearly all areas of fixed income, driven by surging inflation and the Fed’s unprecedented interest-rate increases.
Rising interest rates is an unusual phenomena for most investors, given interest rates were in secular decline since the early 1980s and more recently were anchored near/at/below zero thanks to zero-interest rate policy (ZIRP) in the United States and Europe’s experiment with negative rates. The change in the yield curve mostly explains why bonds suffered so mightily in 2022.
A silver lining for investors is that the year’s big losses could paint a better picture for 2023 and beyond. Bond yields and bond prices move in opposite directions, and last year’s declines have led to a huge rise in bond yields. Finally, investors who own bonds for income will receive a decent yield.
Source: Bianco Research, J.P. Morgan Asset Management
Elevated volatility persisted
With an uncertain economic landscape, the Fed’s aggressive policy moves, and both stocks and bonds selling off as steeply as they did, higher volatility was a near-constant feature of the markets in 2022.
Volatility in all corners of the market was charged by the market’s back-and-forth thinking about when inflation would roll over and how much the Fed would have to raise interest rates.
That was especially true in the bond market, where volatility – measured by standard deviation – ran at twice its historical level in the last three quarters of the year, a notable occurrence for a market that most investors look to for stability.
Source: Morningstar
That’s all for today.
Blake
Welcome to The Sandbox Daily, a daily curation of relevant research at the intersection of markets, economics, and lifestyle. We are committed to delivering high-quality and timely content to help investors make sense of capital markets.
Blake Millard is the Director of Investments at Sandbox Financial Partners, a Registered Investment Advisor. All opinions expressed here are solely his opinion and do not express or reflect the opinion of Sandbox Financial Partners. This Substack channel is for informational purposes only and should not be construed as investment advice. Clients of Sandbox Financial Partners may maintain positions in the markets, indexes, corporations, and/or securities discussed within The Sandbox Daily.
Table uses total returns and bond performance in this data set is derived from the U.S. 10-year Treasury.
This data uses the Bloomberg U.S. Aggregate Bond Index back until its 1976 inception, then Strategas/Ibbotson for returns dating 1950-1975.


