

💥 Firing on all cylinders 💥
The Sandbox Daily (5.13.2025)

Welcome, Sandbox friends.
Today’s Daily discusses:
firing on all cylinders
Let’s dig in.
Blake
Markets in review
EQUITIES: Nasdaq 100 +1.58% | S&P 500 +0.72% | Russell 2000 +0.49% | Dow -0.64%
FIXED INCOME: Barclays Agg Bond -0.10% | High Yield +0.18% | 2yr UST 4.004% | 10yr UST 4.471%
COMMODITIES: Brent Crude +2.43% to $66.54/barrel. Gold +0.95% to $3,258.8/oz.
BITCOIN: +1.93% to $104,525
US DOLLAR INDEX: -0.85% to 100.919
CBOE TOTAL PUT/CALL RATIO: 0.85
VIX: -0.92% to 18.22
Quote of the day
“No man ever steps in the same river twice, for it's not the same river and he's not the same man.”
- Heraclitus
Firing on all cylinders
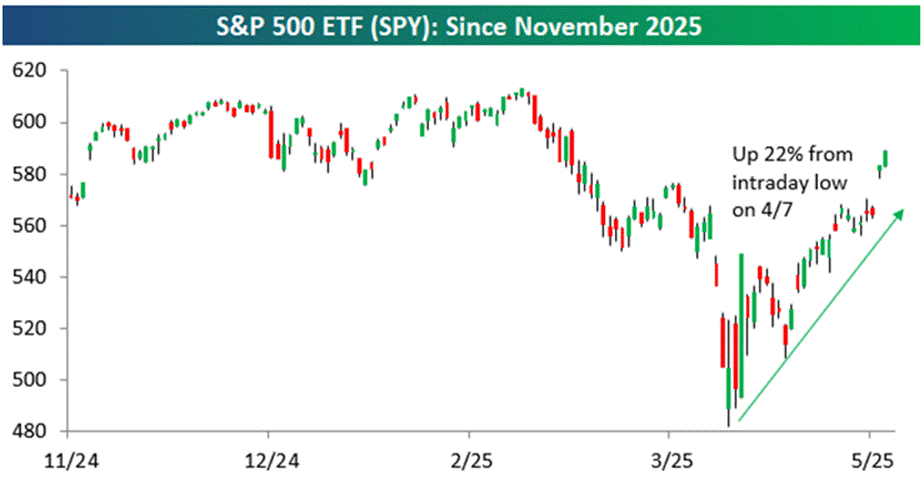
The broad-based rally over the last month has the S&P 500 now up 22% since its intra-day low on April 7th, wiping out the stock market’s losses for the year on bets that tensions around President Trump’s trade war are cooling on the same day CPI inflation data showed limited impacts thus far.
Per data from Bespoke Investment Group, it took just 25 trading days to reverse its 15% decline from April 8 and trade back into positive territory. The last time the S&P 500 reversed a 15%+ year-to-date decline in less than six weeks was 1982.
Even more encouraging, the New York Stock Exchange Advance-Decline Line is currently hitting an all-time high.
An Advance-Decline Line is calculated by taking the difference between Advancing stocks and Declining stocks on a given day, and then adding that result to the prior day's already existing A-D line. And, when the world’s most important universe of stocks continues to push higher, it becomes an informative measure of market breadth that confirms the price action we’re seeing among the major index averages.
Historically, when an all-time high in breadth precedes the overall index’s all-time high in price, it bodes well for the overall market to follow suit in the near future.

As if the bulls need more ammo, the widely followed deGraaf Breadth Thrust also triggered this week, signaling the start of a new bullish regime that aligns with many of the other breadth indicators that have fired over the last couple weeks.
With over 55% of S&P 500 stocks trading at 20-day highs, this deGraaf momentum indicator is a historically significant signal that marks the start of a new bullish regime lasting one year.
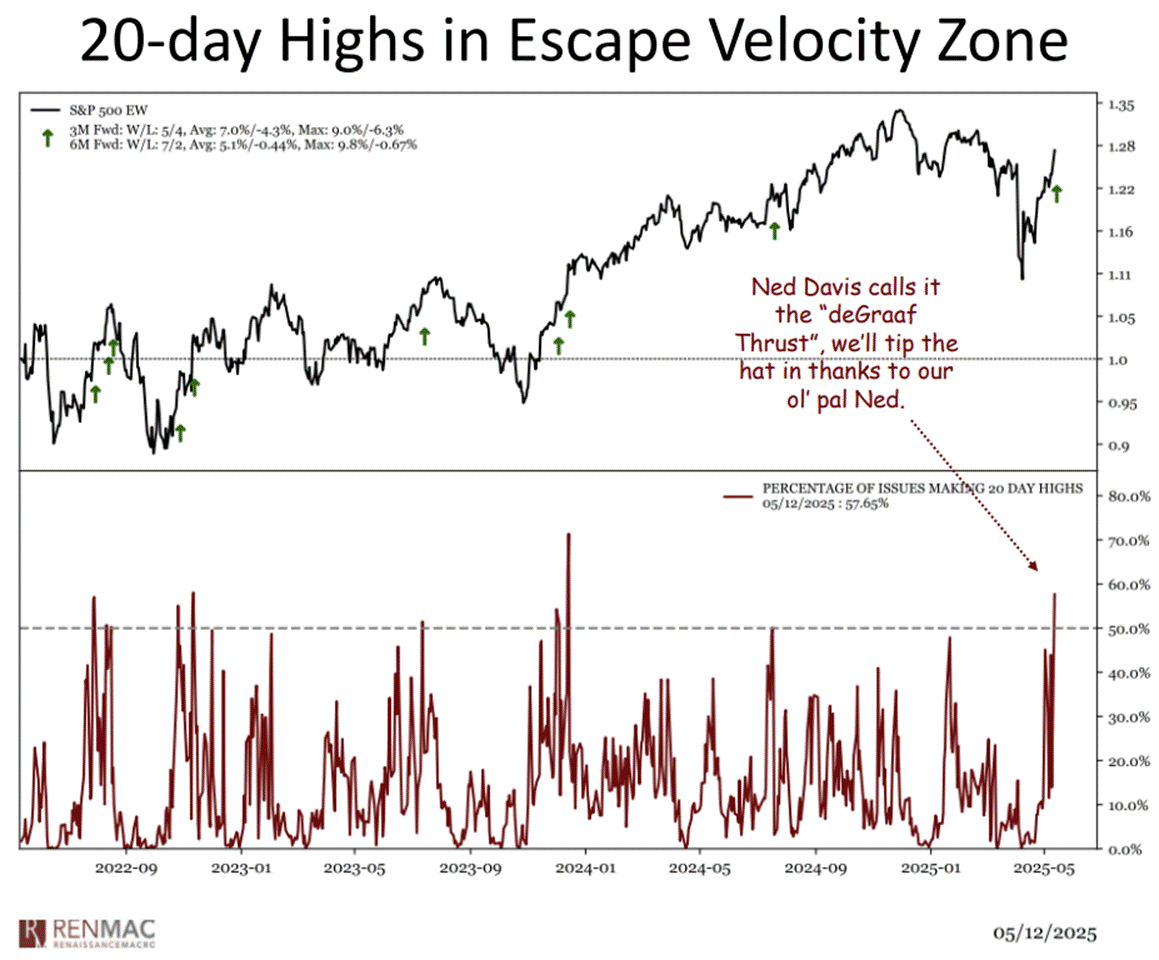
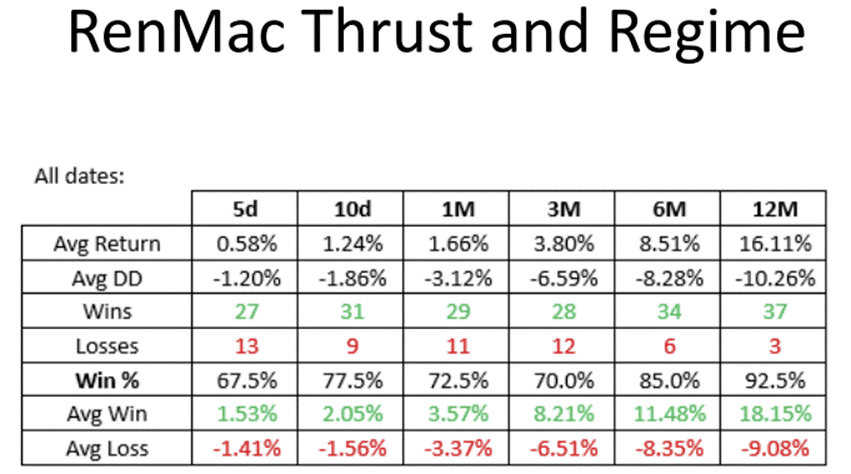
Historically, when the deGraaf Breadth Thrust fires, the S&P 500 is higher 6-months later by a median return of +8.5% with a 85% positivity ratio, and higher 12-months later by a median return of +16.1% with a 93% hit ratio. See below.
These clusters of breadth and momentum thrusts – occurring alongside the recent strong April jobs report, cooling inflation data, and 180-degree U-turn in tariff rhetoric – is showing the rally off the April lows to be one of the strongest and most persistent in decades.
After waterfall declines in the stock market had investor sentiment reaching historically washed out levels, the v-shaped recovery has account balances recovering their painful losses from Q1 with all-time highs on the various large-cap indices next in the crosshairs.
Sources: Bloomberg, Bespoke Investment Group, SubuTrade, Renaissance Macro Research
That’s all for today.
Blake
Questions about your financial goals or future?
Connect with a Sandbox financial advisor – our team is here to support you every step of the way!
Welcome to The Sandbox Daily, a daily curation of relevant research at the intersection of markets, economics, and lifestyle. We are committed to delivering high-quality and timely content to help investors make sense of capital markets.
Blake Millard is the Director of Investments at Sandbox Financial Partners, a Registered Investment Advisor. All opinions expressed here are solely his opinion and do not express or reflect the opinion of Sandbox Financial Partners. This Substack channel is for informational purposes only and should not be construed as investment advice. The information and opinions provided within should not be taken as specific advice on the merits of any investment decision by the reader. Investors should conduct their own due diligence regarding the prospects of any security discussed herein based on such investors’ own review of publicly available information. Clients of Sandbox Financial Partners may maintain positions in the markets, indexes, corporations, and/or securities discussed within The Sandbox Daily. Any projections, market outlooks, or estimates stated here are forward looking statements and are inherently unreliable; they are based upon certain assumptions and should not be construed to be indicative of the actual events that will occur.
Please see additional disclosures at the Sandbox Financial Partners website: