

Iran conflict: monitoring three otherwise bullish indicators that could flip bearish
The Sandbox Daily (3.17.2026)

Welcome, Sandbox friends.
I was delighted to share my highest conviction idea with Phil Rosen’s Best Ideas Club, a company I’ve followed and owned for the last decade. I’ve always been fascinated by businesses that offer asymmetric potential, and this company delivers that opportunity better than any other.
Check out the write-up and Phil Rosen’s Opening Bell Daily for more awesome content on markets and personal finance.

Today’s Daily discusses:
Iran conflict: monitoring three otherwise bullish indicators that could flip bearish
Let’s dig in.
Blake
Markets in review
EQUITIES: Russell 2000 +0.67% | Nasdaq 100 +0.51% | S&P 500 +0.25% | Dow +0.10%
FIXED INCOME: Barclays Agg Bond +0.20% | High Yield +0.45% | 2yr UST 3.676% | 10yr UST 4.202%
COMMODITIES: Brent Crude +3.39% to $103.61/barrel. Gold +0.11% to $5,007.6/oz.
BITCOIN: +0.79% to $74,558
US DOLLAR INDEX: -0.16% to 99.56
CBOE TOTAL PUT/CALL RATIO: 1.05
VIX: -4.85% to 22.37
Quote of the day
“Service to others is the rent you pay for your room here on earth.”
- Muhammad Ali
Iran conflict: monitoring three otherwise bullish indicators that could flip bearish
Continuing yesterday’s discussion over the Iran conflict, we’re flagging three important implications worth monitoring for the economy and U.S. stocks in the coming days, weeks, and months.
Coming into the year, one of the primary concerns was that the market was vulnerable to the typical midterm year correction, given three strong consecutive years of double-digit index gains and historically elevated valuations.
Market declines, even ones as consistent as during Q2 – Q3 of midterm years, require a catalyst.
The three items on my list below discuss how the Iran conflict could be a catalyst by flipping otherwise bullish indicators bearish.
Rekindling inflationary spirits
An obvious candidate is inflation.
Headline CPI, which unlike the Fed’s preferred inflation gauge includes energy prices, has been in a downward trajectory since August 2022. Hence, I consider disinflation as having been one of the key drivers of the cyclical bull market.
The good news for the bulls is that there is plenty of wiggle room for inflation to rise before this key inflation indicator turns bearish. The year-on-year change in the CPI (2.4%) sits below the 6-month average (2.8%), so some near-term effects can be absorbed before it becomes problematic.
While unit labor costs are tame and inflation expectations remain well-anchored, the Fed must closely monitor downstream impacts from this oil shock and rising energy input costs.
Throughout modern market history, oil shocks are often associated with recessionary economic conditions.
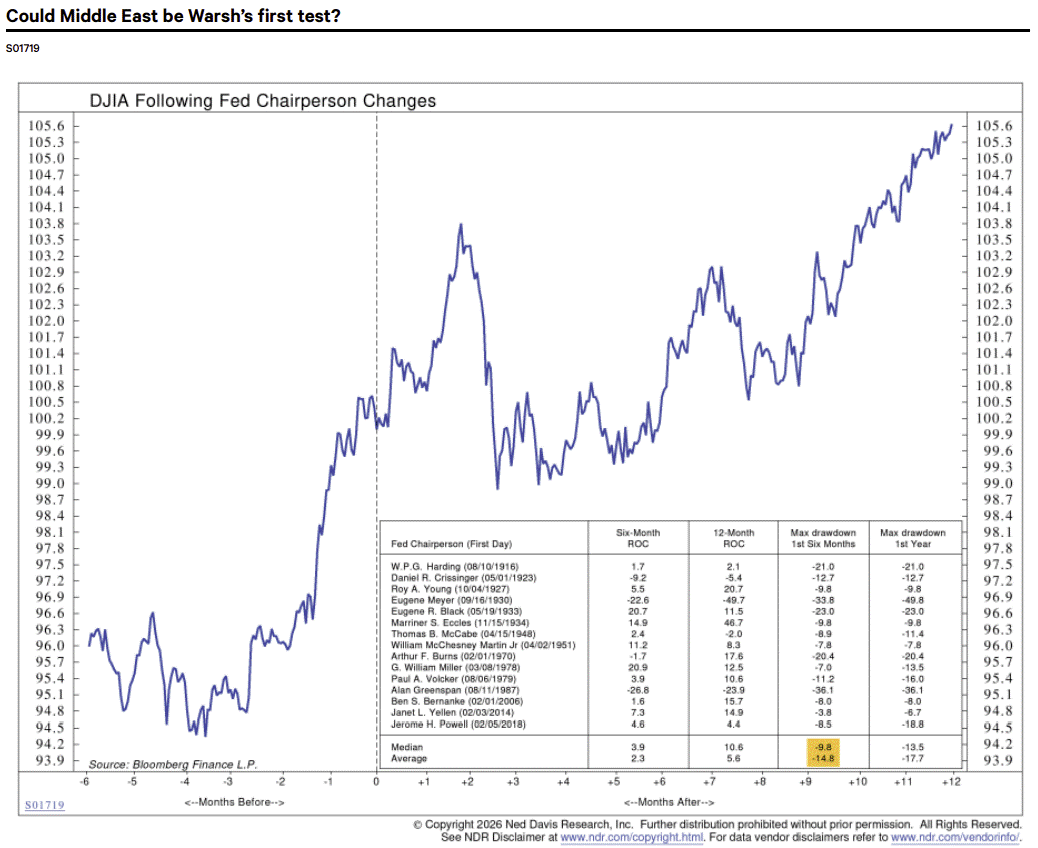
Fed’s tricky path in 2026
The market hates uncertainty, and a new Fed chair generates additional uncertainty around future monetary policy.
While the early days of some new Fed chairs have gone smoothly, in other cases, new chairs have faced crises. The average correction of 14.8% during the first 6 months implies that investors have sold first and asked questions later.
Investors have expected a Warsh-led Fed to be dovish, at least when it comes to the Fed Funds Rate early in his term. Assuming he is confirmed in the next few months, a protracted war in the Middle East could delay the next phase of the easing cycle.
Rotation confusion
From a technical perspective, the defining characteristic of 2026 year-to-date is the rotation out of previous winners of large-cap tech stocks and into real economy “HALO” stocks.
Rotations and consolidations can be healthy in that they prevent the market from becoming too narrow. If they go on for too long, however, they can morph into a topping process.
This is the current state of affairs for the S&P 500, and the churning under the hood is spooking investors.
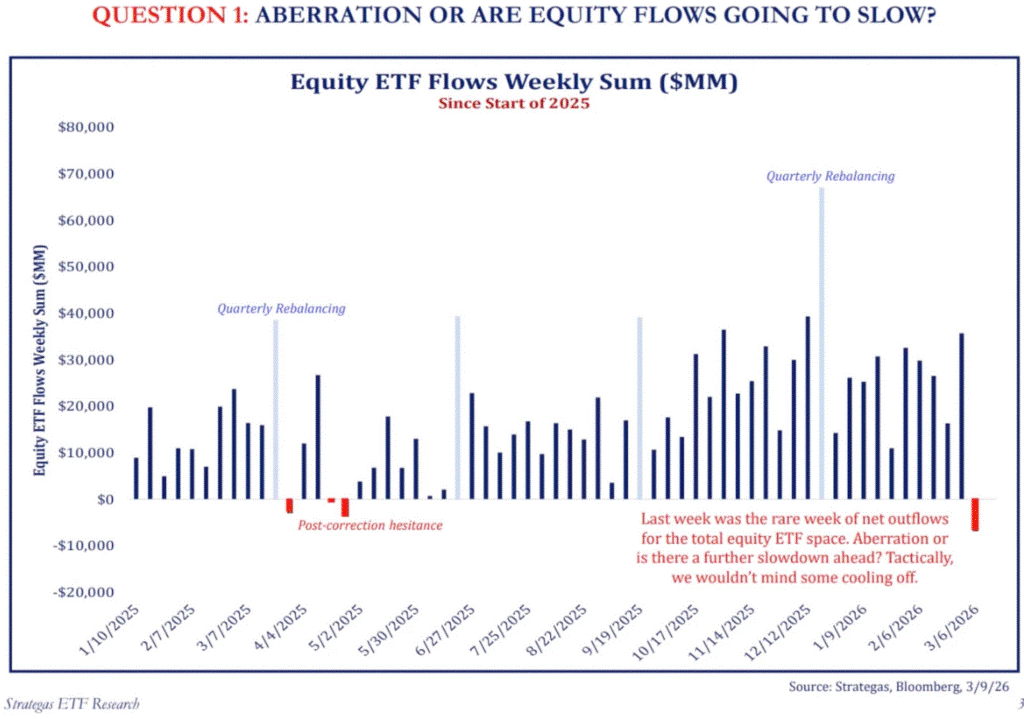
With the S&P 500 pulling back ~5% from its January highs, some investors have been tempted to side-step this Iran conflict and “wait for things to calm down.” In fact, investors pulled money out of U.S. equity funds for the first time since last April – see the chart below.
Technology has been the pillar of strength this entire cycle, although it’s been dead money for the last six months. If the sector that normally leads bull markets continues to break down, we may need to start asking if something more ominous is brewing.
Bottom line?
Barring a prolonged disruption of global oil supplies, the conflict is unlikely to end the 3.5-year cyclical bull market by itself. Instead, add it to the growing list of risks the market is facing heading into the middle of midterm years.
Sources: Exhibit A, Ned Davis Research, Todd Sohn (Strategas)
That’s all for today.
Blake
Questions about your financial goals or future?
Connect with a Sandbox financial advisor – our team is here to support you every step of the way!
Welcome to The Sandbox Daily, a daily curation of relevant research at the intersection of markets, economics, and lifestyle. We are committed to delivering high-quality and timely content to help investors make sense of capital markets.
Blake Millard is the Director of Investments at Sandbox Financial Partners, a Registered Investment Advisor. All opinions expressed here are solely his opinion and do not express or reflect the opinion of Sandbox Financial Partners. This Substack channel is for informational purposes only and should not be construed as investment advice. The information and opinions provided within should not be taken as specific advice on the merits of any investment decision by the reader. Investors should conduct their own due diligence regarding the prospects of any security discussed herein based on such investors’ own review of publicly available information. Clients of Sandbox Financial Partners may maintain positions in the markets, indexes, corporations, and/or securities discussed within The Sandbox Daily. Any projections, market outlooks, or estimates stated here are forward looking statements and are inherently unreliable; they are based upon certain assumptions and should not be construed to be indicative of the actual events that will occur.
Please see additional disclosures (click here)
Please see our SEC Registered firm brochure (click here)
Please see our SEC Registered Form CRS (click here)