

Market's catch a chill
The Sandbox Daily (1.13.2025)

Welcome, Sandbox friends.
Today’s Daily discusses:
a winter’s cold
Let’s dig in.
Blake
Markets in review
EQUITIES: Dow +0.86% | Russell 2000 +0.24% | S&P 500 +0.16% | Nasdaq 100 -0.30%
FIXED INCOME: Barclays Agg Bond -0.09% | High Yield -0.03% | 2yr UST 4.388% | 10yr UST 4.784%
COMMODITIES: Brent Crude +1.38% to $80.86/barrel. Gold -1.23% to $2,681.8/oz.
BITCOIN: -0.16% to $94,398
US DOLLAR INDEX: +0.09% to 109.751
CBOE TOTAL PUT/CALL RATIO: 0.97
VIX: -1.79% to 19.19
Quote of the day
“The tape tells all, and our job is to learn how to listen properly.”
- Stan Weinstein
A winter’s cold
The stock market has struggled in recent weeks as concerns have grown around interest rates, a stronger U.S. dollar, policy uncertainty, and the direction of the economy.
Since the market peak on December 6th of last year, the S&P 500 has pulled back 4.3% while the 10-year Treasury yield has screamed higher from 4.15% to 4.78%.
Under the surface its much worse. When zero sectors are trading above their short-term averages (50-DMA, below left) and just 11% of stocks are trading above their short- and longer-dated timeframes (50-DMA and 200-DMA in green, below right) – both their lowest readings in over a year, the weakness appears to be growing and spreading like a winter’s cold.
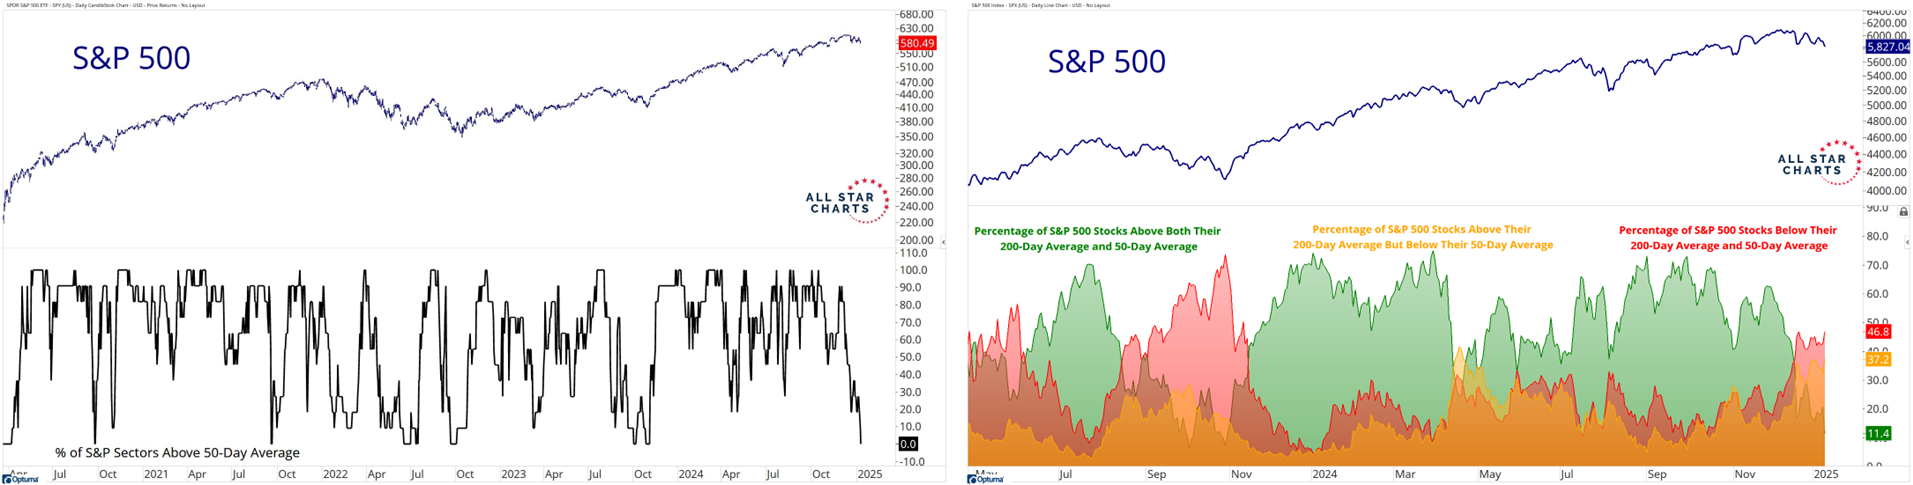
One measure to keep a close eye on over the coming week is the 20-day New Lows list, which is expanding quickly and seems to be fast approaching the recent peak we saw in late December (bottom pane below).
You can't have a correction in the stock market without an expansion in the number of stocks making new lows. If we are going to see a bigger reset materialize, the damage will show up here first.
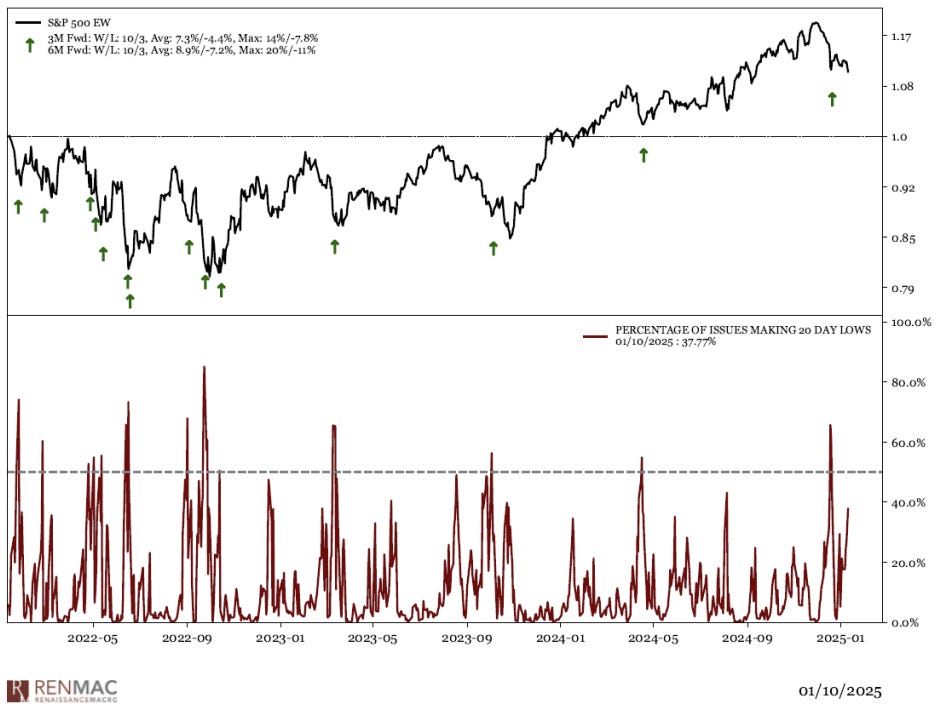
Despite the growing list of headwinds, the selloff thus far has proven far more orderly than back in December. Investors looking for evidence of capitulation in this selling pressure may be disappointed when the selling merely dries up and prices start to turn higher.
Perhaps this recent market decline could also reflect a natural adjustment as investors digest new economic data.
Last week’s Prices Paid component for the ISM Services report jumped to its highest level for prices since February 2023, a measure that also correlates/points to a coming reacceleration in inflation. Then Friday’s jobs report for December was a blowout and came in much stronger than expected. Both indicators point towards an economy that may need less support from the Federal Reserve in the form of lower interest rates.
At the moment, the market believes the Fed will cut interest rates just once in 2025, and that this may be the final cut of the cycle. However, these expectations can shift quickly, as they did throughout 2024.
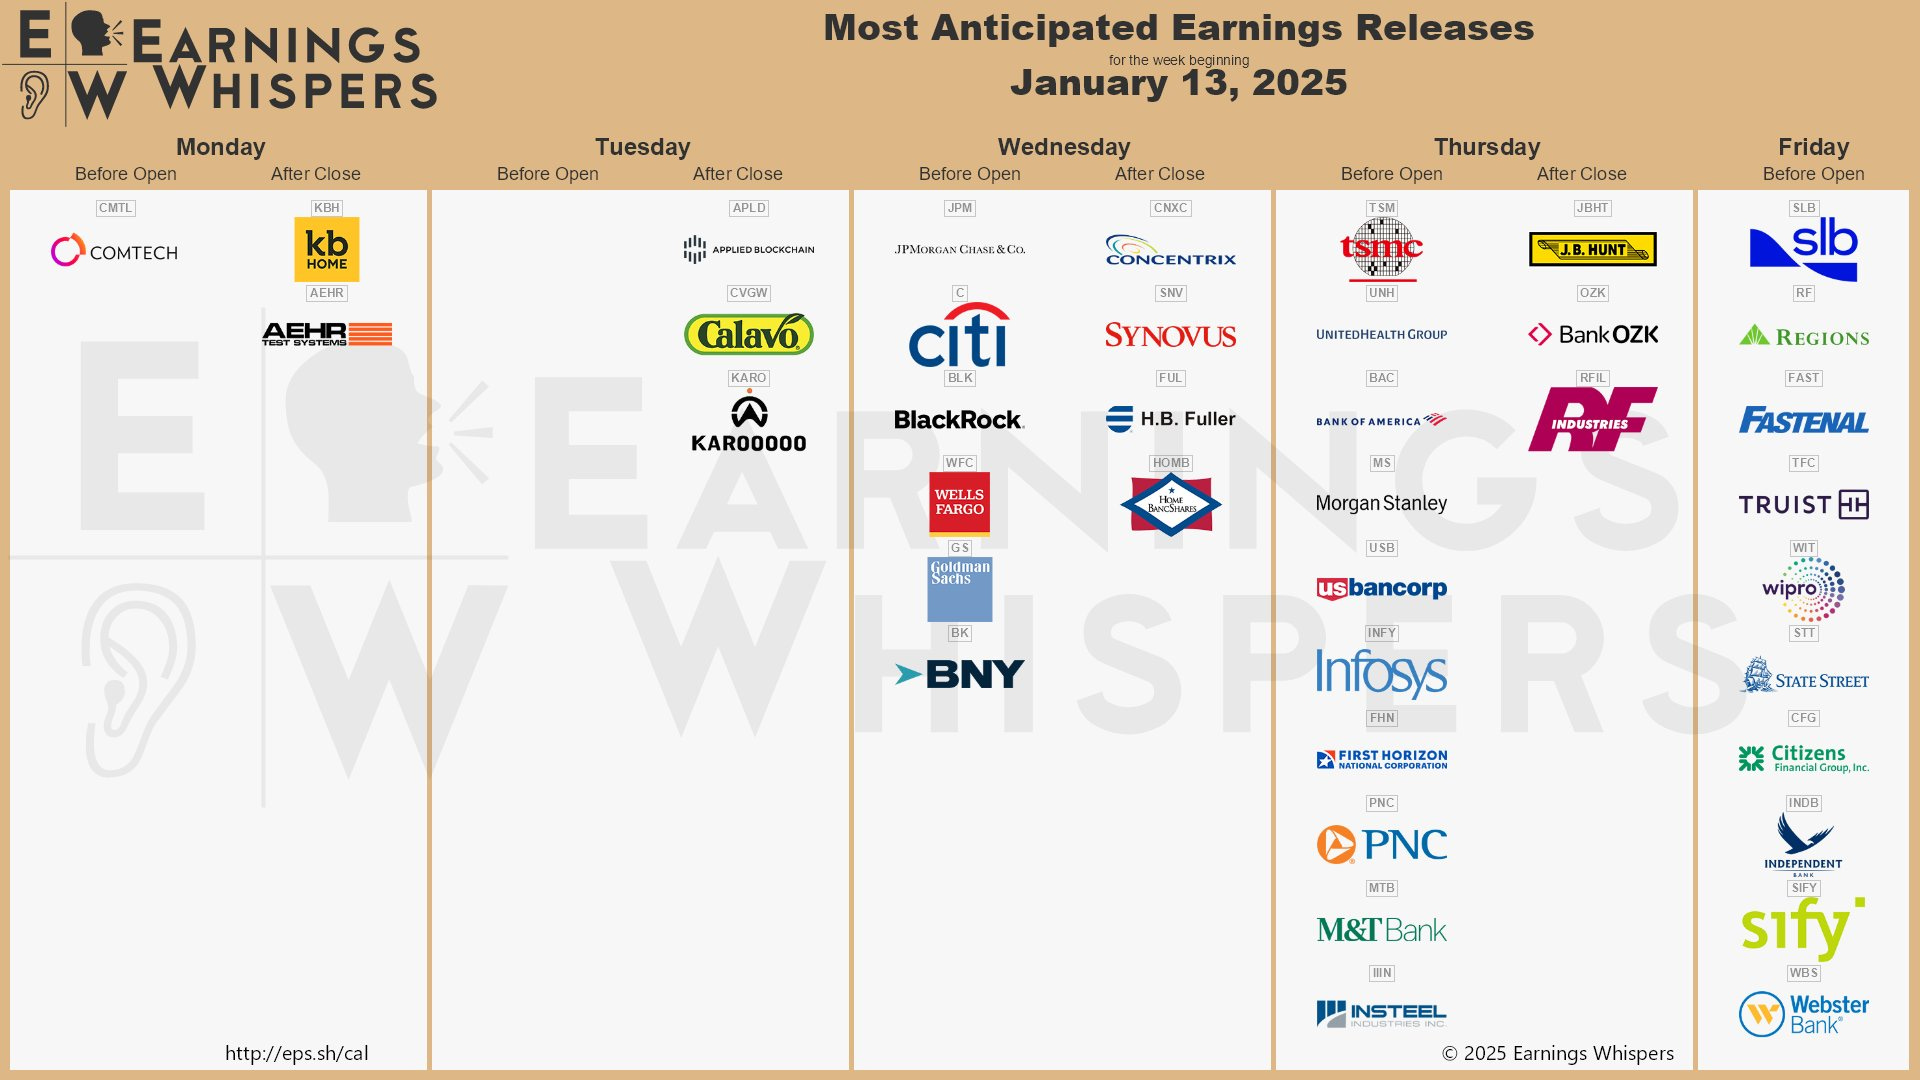
Perhaps the antidote to the pervasive market weakness and its winter cold are corporate earnings, which begin on Wednesday with the banks reporting their Q4 results.
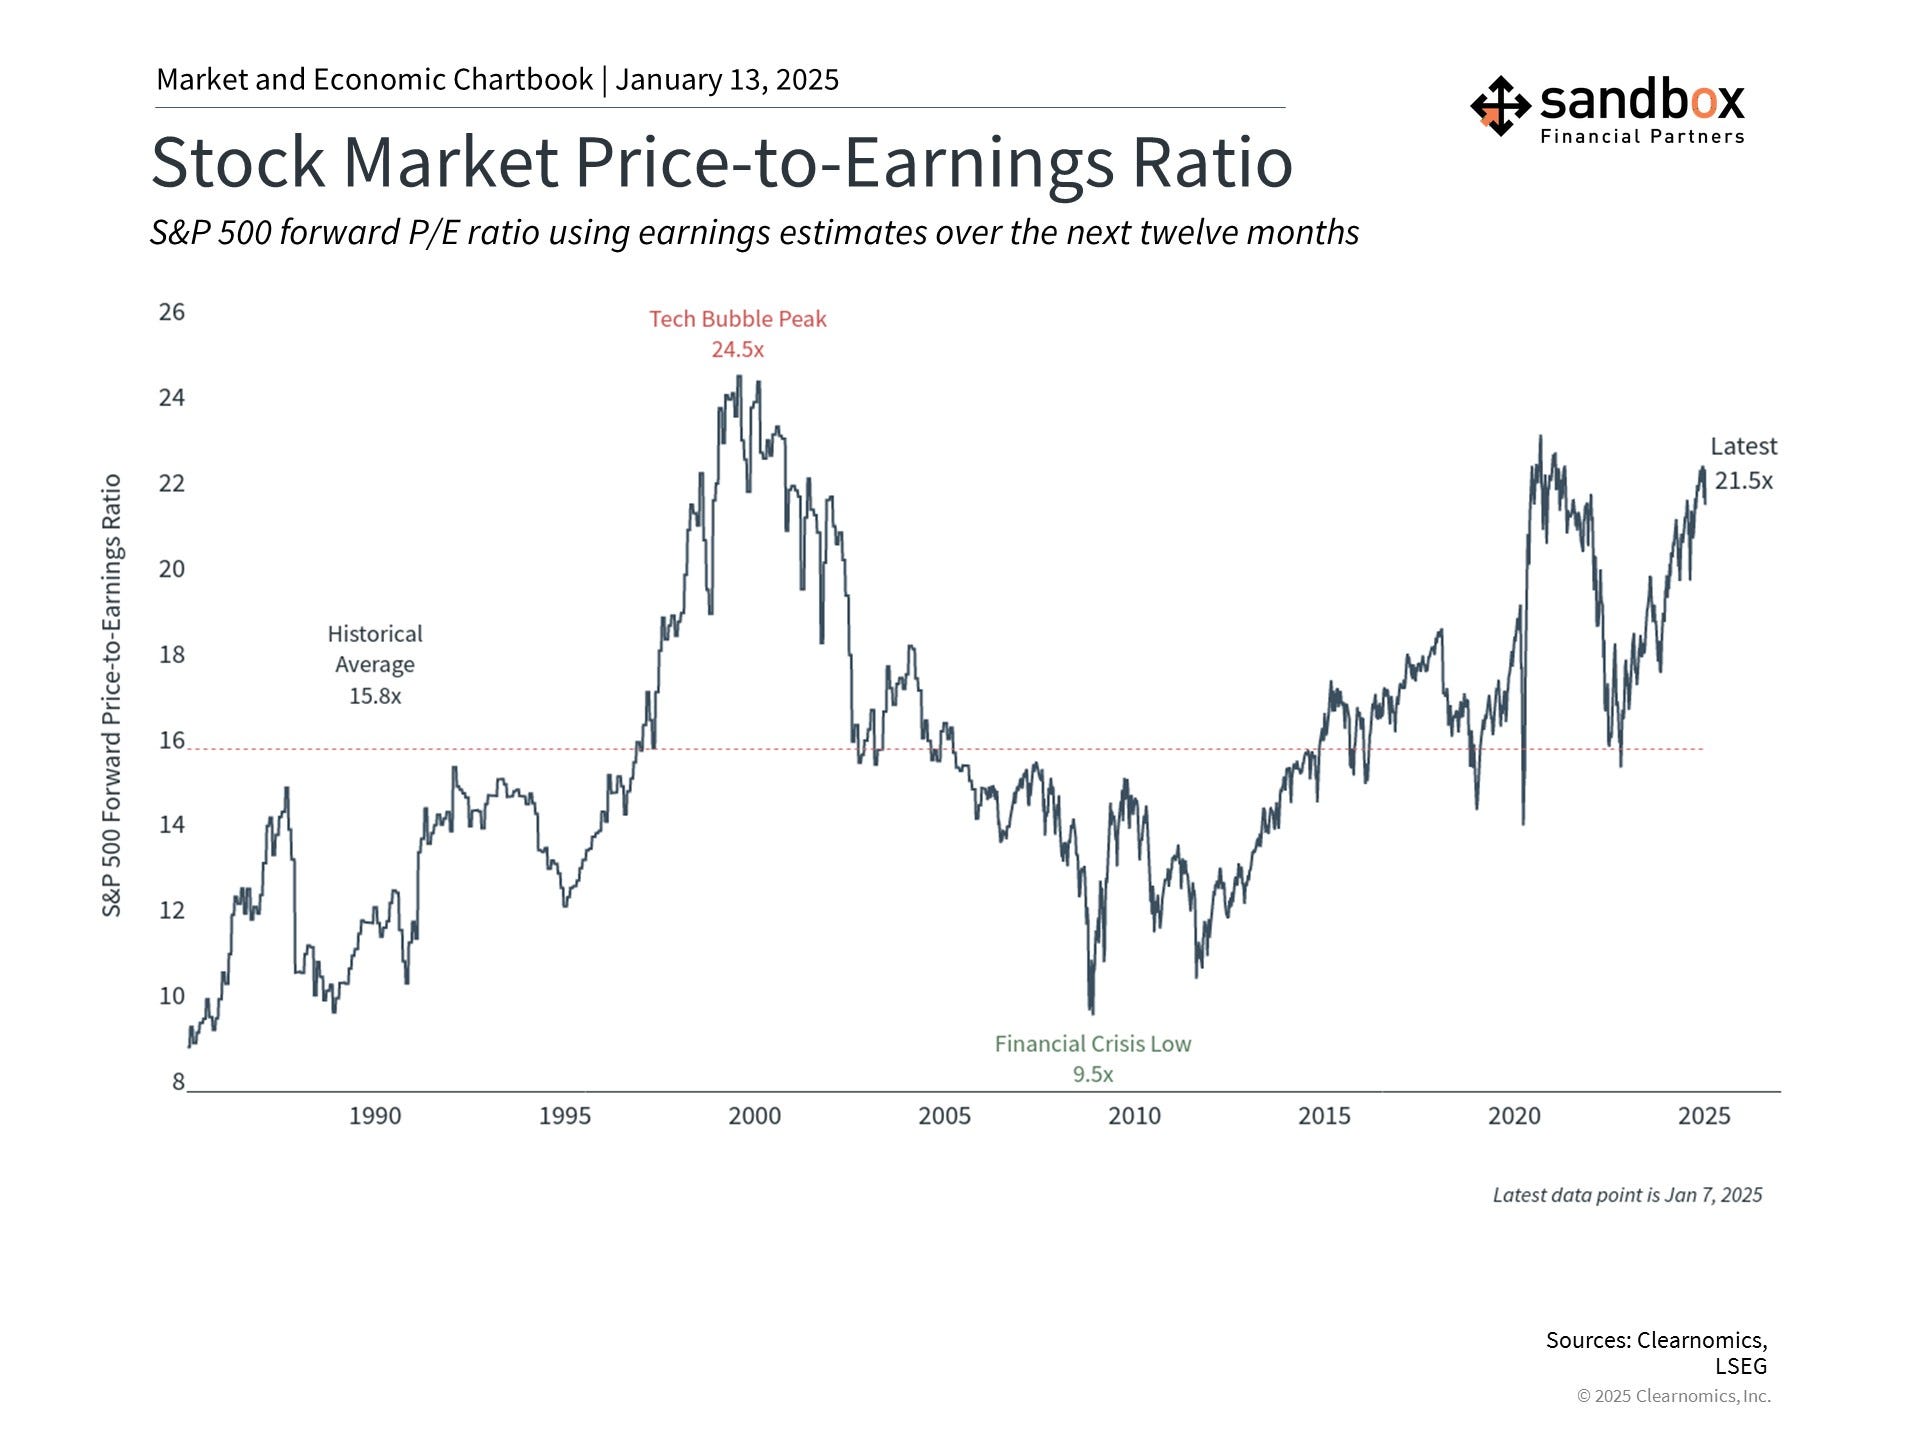
Investors are looking for earnings to deliver the goods in 2025 after multiple expansion carried much of the torch in 2024.
In fact, the most significant difference investors face this year versus 2024 is that stock market valuations are well above average.
As the chart below shows, the price-to-earnings ratio for the S&P 500 is 21.5x, over one-standard deviation expensive and near its highest level in recent years – not far from the all-time peak of 24.5x during the dot-com bubble.
In fact, some investors wonder if there is a market bubble today, or at least one in AI stocks.
A high price-to-earnings ratio means that investors are paying more for every dollar of earnings than in the past. This means that future returns may be lower, or equivalently, that markets have gotten ahead of future returns.
The key question is whether the underlying economic and market fundamentals are healthy, or if the market rally is built more on lofty earnings expectations.
Today, the economy is still growing steadily, the job market remains resilient beyond most measures, and the companies with the most enthusiasm have robust earnings.
When valuations are high, the solution is not to avoid stocks altogether. Instead, it’s to stay balanced across different parts of the market that can outperform at different times. These might include sectors beyond Information Technology or Industrials, and also investment styles such as value, small-caps, or other uncorrelated opportunities.
The key is to hold a portfolio that is appropriate for your specific financial goals, risk tolerance, and time horizon.
Source: Grant Hawkridge, RenMac, Earnings Whispers, Clearnomics
That’s all for today.
Blake
Questions about your financial goals or future?
Connect with a Sandbox financial advisor – our team is here to support you every step of the way!
Welcome to The Sandbox Daily, a daily curation of relevant research at the intersection of markets, economics, and lifestyle. We are committed to delivering high-quality and timely content to help investors make sense of capital markets.
Blake Millard is the Director of Investments at Sandbox Financial Partners, a Registered Investment Advisor. All opinions expressed here are solely his opinion and do not express or reflect the opinion of Sandbox Financial Partners. This Substack channel is for informational purposes only and should not be construed as investment advice. The information and opinions provided within should not be taken as specific advice on the merits of any investment decision by the reader. Investors should conduct their own due diligence regarding the prospects of any security discussed herein based on such investors’ own review of publicly available information. Clients of Sandbox Financial Partners may maintain positions in the markets, indexes, corporations, and/or securities discussed within The Sandbox Daily. Any projections, market outlooks, or estimates stated here are forward looking statements and are inherently unreliable; they are based upon certain assumptions and should not be construed to be indicative of the actual events that will occur.
Please see additional disclosures at the Sandbox Financial Partners website: