The largest stocks move the market, plus changing market leadership??, home sales report bombs 💣, and the alphabet portfolio
The Sandbox Daily (8.29.2024)
Welcome, Sandbox friends.
The U.S. economy continues to display robust strength as real GDP expanded by +3.0% in the second quarter (upwardly revised from July’s initial estimate of +2.8%), AI darling Super Micro Computer Inc (SMCI) has been blown up by short seller Hindenburg Research, and more record closes for both the Dow Jones Industrial Average and the equal-weight S&P 500 index.
Today’s Daily discusses:
largest stocks continue to move the market
bond-like equity proxies have outperformed as yields have fallen
pending home sales drops to lowest on record
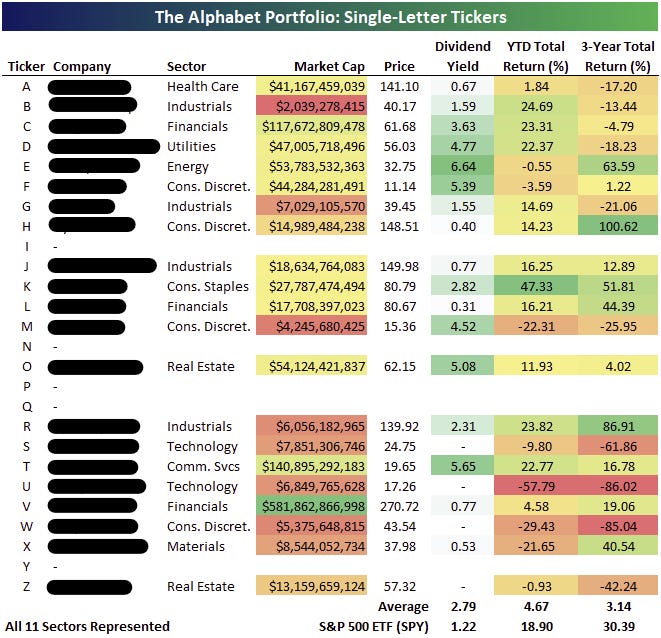
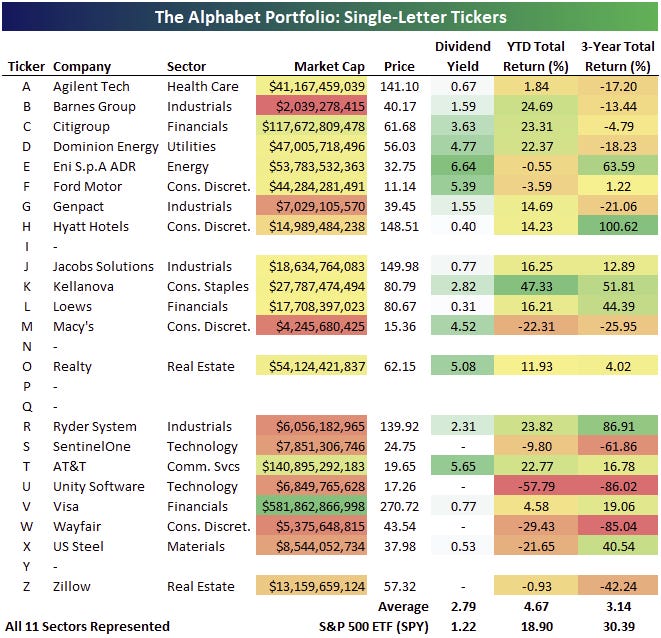
the alphabet portfolio revealed
Let’s dig in.
Markets in review
EQUITIES: Russell 2000 +0.66% | Dow +0.59% | S&P 500 -0.01% | Nasdaq 100 -0.13%
FIXED INCOME: Barclays Agg Bond -0.13% | High Yield +0.10% | 2yr UST 3.895% | 10yr UST 3.867%
COMMODITIES: Brent Crude +1.72% to $80.01/barrel. Gold +0.68% to $2,554.9/oz.
BITCOIN: +1.23% to $59,377
US DOLLAR INDEX: +0.27% to 101.372
CBOE EQUITY PUT/CALL RATIO: 0.64
VIX: -8.53% to 15.65
Quote of the day
“A group of people who think differently is a market. A group of people who think alike is a mob.”
- Naval
Largest stocks continue to move the market
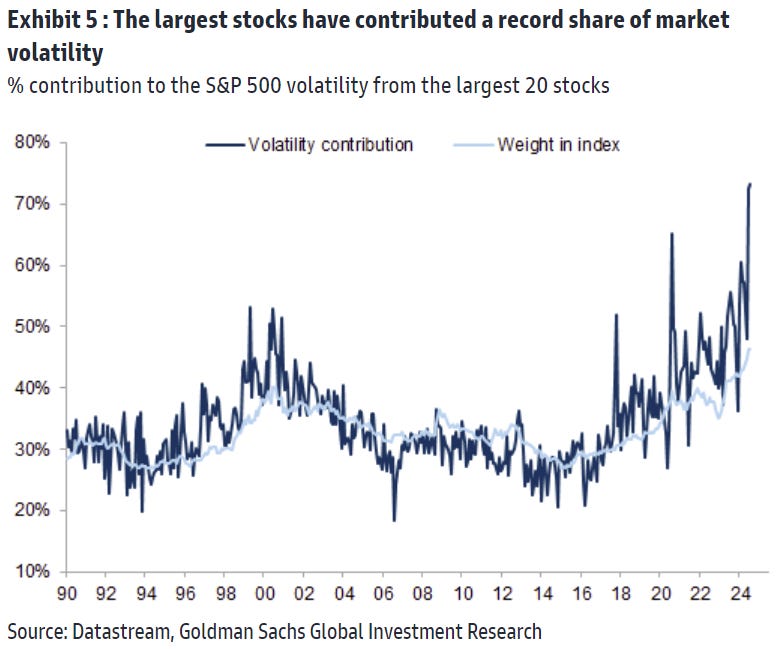
This year investors have been widely discussing the high U.S. market concentration into mega-cap Tech stocks and the potential risks to the market that would emanate from a positioning unwind or disappointments on the size of future estimated returns on AI investments.
Historically, the market has tended to rally following a peak in concentration as previous laggards catch up (catch higher?) to the market leaders during supportive macro backdrops. This is why “buy-the-dip” has worked so well for U.S. investors over the years.
That being said, today the largest stocks in the S&P 500 not only make up a record share of its market cap, but they also drive a record share of its volatility.
Source: Goldman Sachs Global Investment Research
Bond-like equity proxies have outperformed as yields have fallen
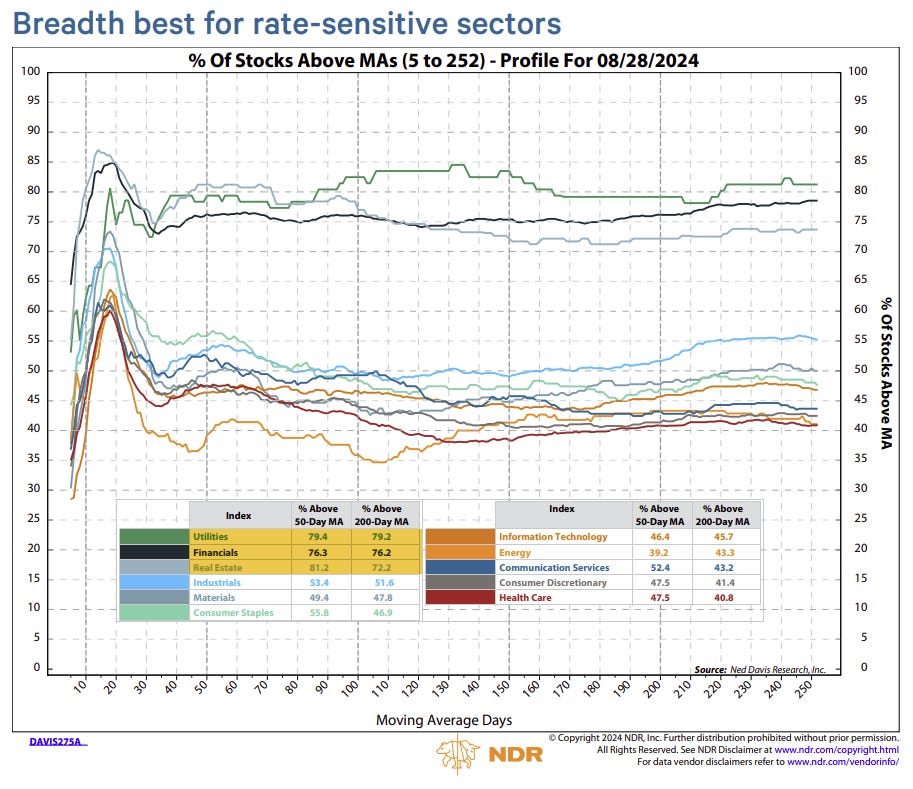
The traditionally highest-paying dividend sectors – what can be referenced as bond-like equity proxies – are typically negatively correlated with rates.
These groups struggled as the 10-year Treasury yield climbed higher from 3.9% at the start of the year to 4.7% in April. The subsequent pullback since rates peaked at their local high in late April has proved a more positive backdrop for these assets, which have been among the best performers in Q3.
Rate-sensitive sectors (both positive and negative) have seen remarkably strong breadth, with readings from Utilities, Financials, and Real Estate head and shoulders above all other sectors.
Source: Ned Davis Research
Index for U.S. pending home sales dropped to lowest on record
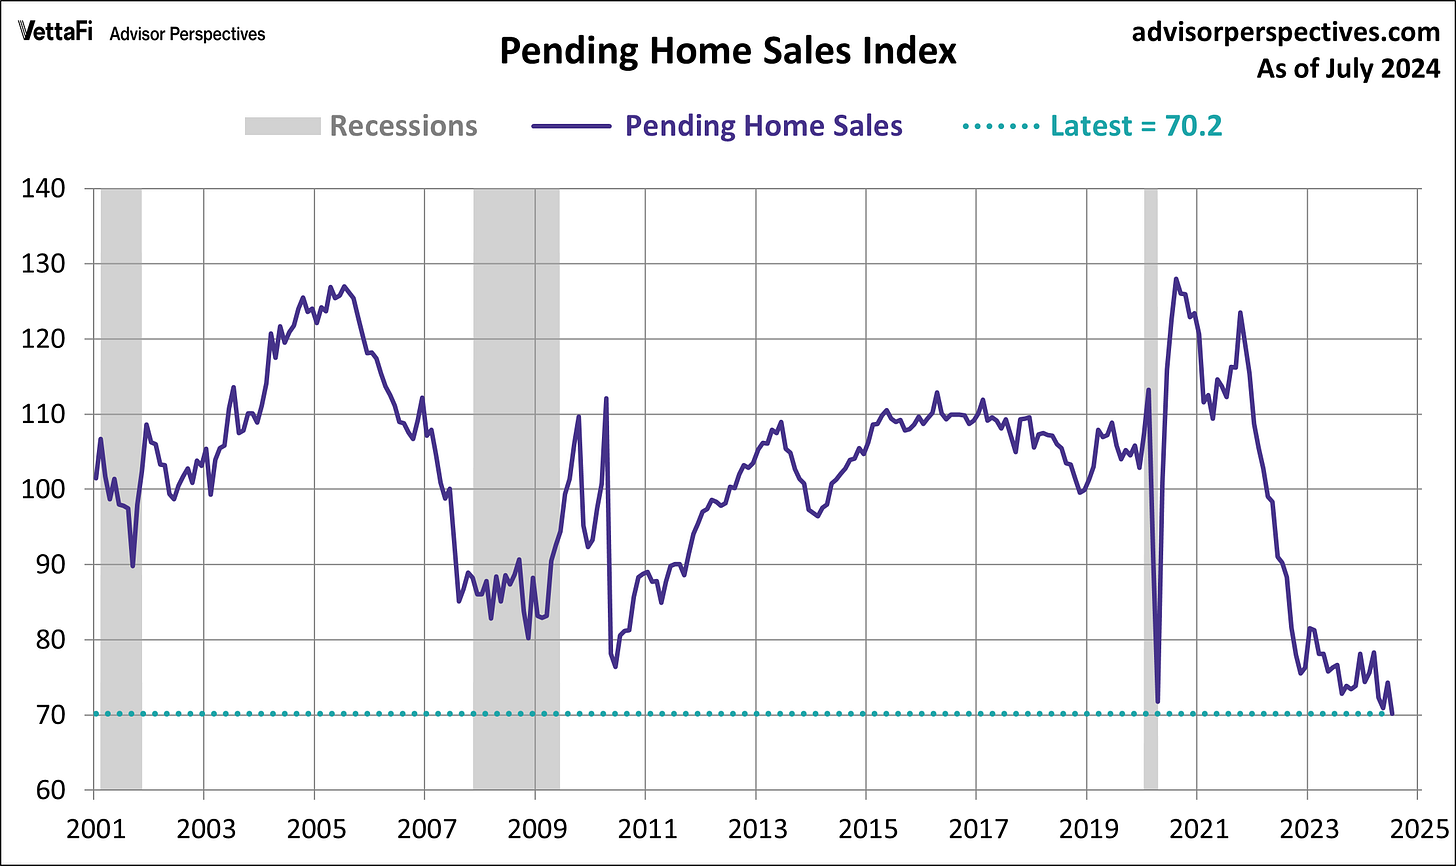
Contracts to buy U.S. previously owned homes dropped 5.5% in July to a new record low.
Even though mortgage rates have declined from their cyclical peak, borrowing costs remain elevated, and the for-sale inventory remains relatively tight amidst lead inventory. Prospective homebuyers continue to face significant affordability challenges.
The Pending Home Sales index from the National Association of Realtors (NAR) dates back to 2001, with the latest tick from July marking the low of the series.
Pending home sales from the NAR tracks home sales where a contract is signed but the transaction hasn’t closed yet. The index is a leading indicator of future existing home sales because it typically takes four to eight weeks to close a home sale after signing the contract.
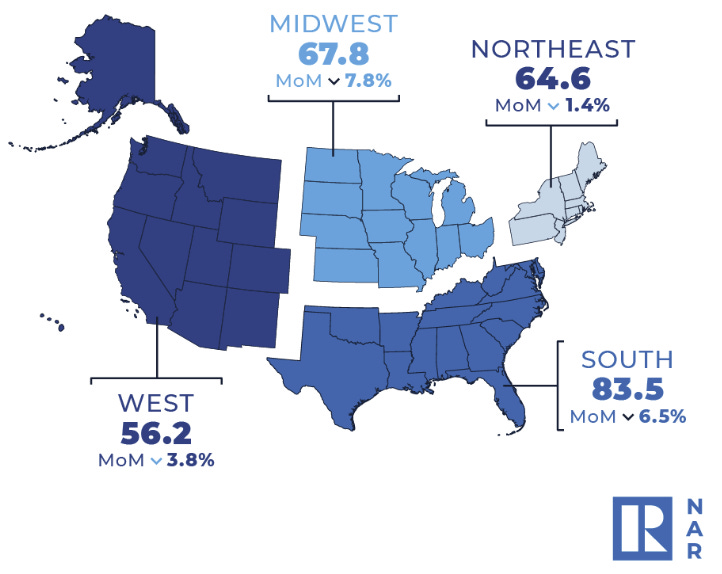
All four U.S. regions posted monthly losses in transactions.
The potential start of a Fed easing cycle in September should put downward pressure on mortgage rates, stimulating both housing starts and home sales, as has been the historical pattern after first Fed rate cuts. For now, however, the slump in contract signing activity in July suggests that existing home sales will remain depressed in the near-term.
"A sales recovery did not occur in midsummer," said NAR Chief Economist Lawrence Yun. "The positive impact of job growth and higher inventory could not overcome affordability challenges and some degree of wait-and-see related to the upcoming U.S. presidential election."
Source: National Association of Realtors, Advisor Perspectives
The alphabet portfolio
We received quite a bit of positive feedback on the alphabet portfolio.
Yesterday, we posed the following trivia question: how many companies can you name in the 1-letter ticker universe?
Here is the unencumbered list.
In full transparency, I only guessed 14 of 21 companies correctly.
Source: Bespoke Investment Group
That’s all for today.
Blake
Welcome to The Sandbox Daily, a daily curation of relevant research at the intersection of markets, economics, and lifestyle. We are committed to delivering high-quality and timely content to help investors make sense of capital markets.
Blake Millard is the Director of Investments at Sandbox Financial Partners, a Registered Investment Advisor. All opinions expressed here are solely his opinion and do not express or reflect the opinion of Sandbox Financial Partners. This Substack channel is for informational purposes only and should not be construed as investment advice. The information and opinions provided within should not be taken as specific advice on the merits of any investment decision by the reader. Investors should conduct their own due diligence regarding the prospects of any security discussed herein based on such investors’ own review of publicly available information. Clients of Sandbox Financial Partners may maintain positions in the markets, indexes, corporations, and/or securities discussed within The Sandbox Daily. Any projections, market outlooks, or estimates stated here are forward looking statements and are inherently unreliable; they are based upon certain assumptions and should not be construed to be indicative of the actual events that will occur.


