

From chaos to calm: markets find their footing
The Sandbox Daily (6.2.2025)

Welcome, Sandbox friends.
Today’s Daily discusses:
May: month in review
Let’s dig in.
Blake
Markets in review
EQUITIES: Nasdaq 100 +0.71% | S&P 500 +0.41% | Russell 2000 +0.19% | Dow +0.08%
FIXED INCOME: Barclays Agg Bond -0.26% | High Yield -0.02% | 2yr UST 3.939% | 10yr UST 4.442%
COMMODITIES: Brent Crude +3.82% to $65.18/barrel. Gold +2.75% to $3,406.6/oz.
BITCOIN: -0.31% to $104,916
US DOLLAR INDEX: -0.66% to 98.674
CBOE TOTAL PUT/CALL RATIO: 0.88
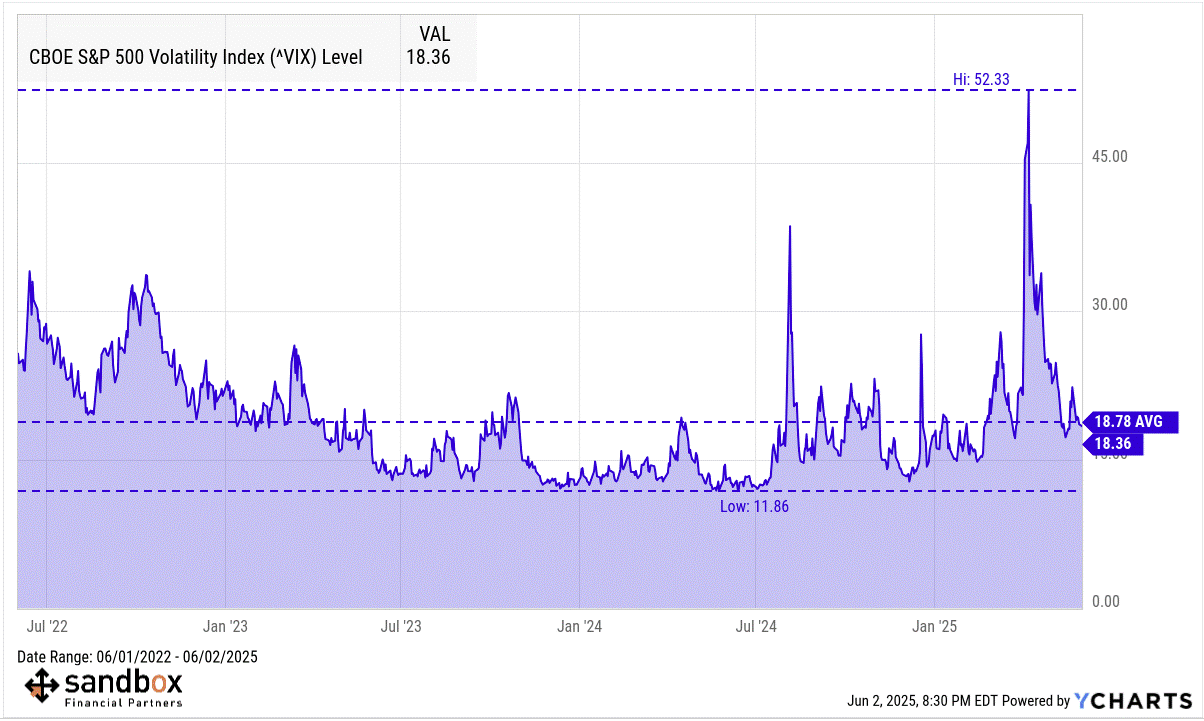
VIX: -1.13% to 18.36
Quote of the day
“The day you plant the seed is not the day you eat the fruit.”
- Fabienne Fredrickson
May: month in review
Financial markets rebounded in May in historic fashion, with the S&P 500 recovering its year-to-date losses. This v-shaped recovery occurred against a backdrop of new trade agreements, mixed economic signals, and ongoing concerns about U.S. fiscal deficits.
While many reports continued to show that the economy is strong, consumers remain pessimistic about the future. Treasury yields have drifted higher due to concerns around federal spending and debt.
For long-term investors, both April and May serve as a reminder that markets move swiftly and adapt to changing conditions rapidly.
Key Market and Economic Drivers
The S&P 500 gained +6.2% in May, while the Nasdaq rose +9.6%
The Bloomberg U.S. Aggregate Bond Index declined -0.7% in May but is up +2.4% year-to-date
International stocks also performed well, with Developed Markets (MSCI EAFE) and Emerging Markets (MSCI EM) both climbing 4.0%
The U.S. dollar index fell further to end the month at 99.3, near a three-year low
Bitcoin hit a new record high of $111k before ending the month at $104k
Gold also hit a new record high of $3,422 before closing the month at $3,288, a 24% year-to-date gain
The Consumer Price Index report released in May showed that consumer prices rose 2.3% in April from a year earlier, the slowest 12-month increase since February 2021
The economy added 177,000 new jobs in April while the unemployment rate remained low at 4.2%
Below are five key takeaways from last month.
Markets climb the wall the worry
May's market rebound underscores the importance of staying the course during periods of market volatility.
After a challenging April, markets demonstrated incredible resilience by recovering most of their losses and returning to positive territory in May. This illustrates how quickly market sentiment can shift when conditions begin to stabilize, a pattern that investors have experienced many times over the past decade.
In fact, the S&P 500 reported its best May return in the last 35 years.

Of course, the past is no guarantee of the future, and markets will continue to worry about trade deals, the U.S. debt, and the health of the economy in the coming months.
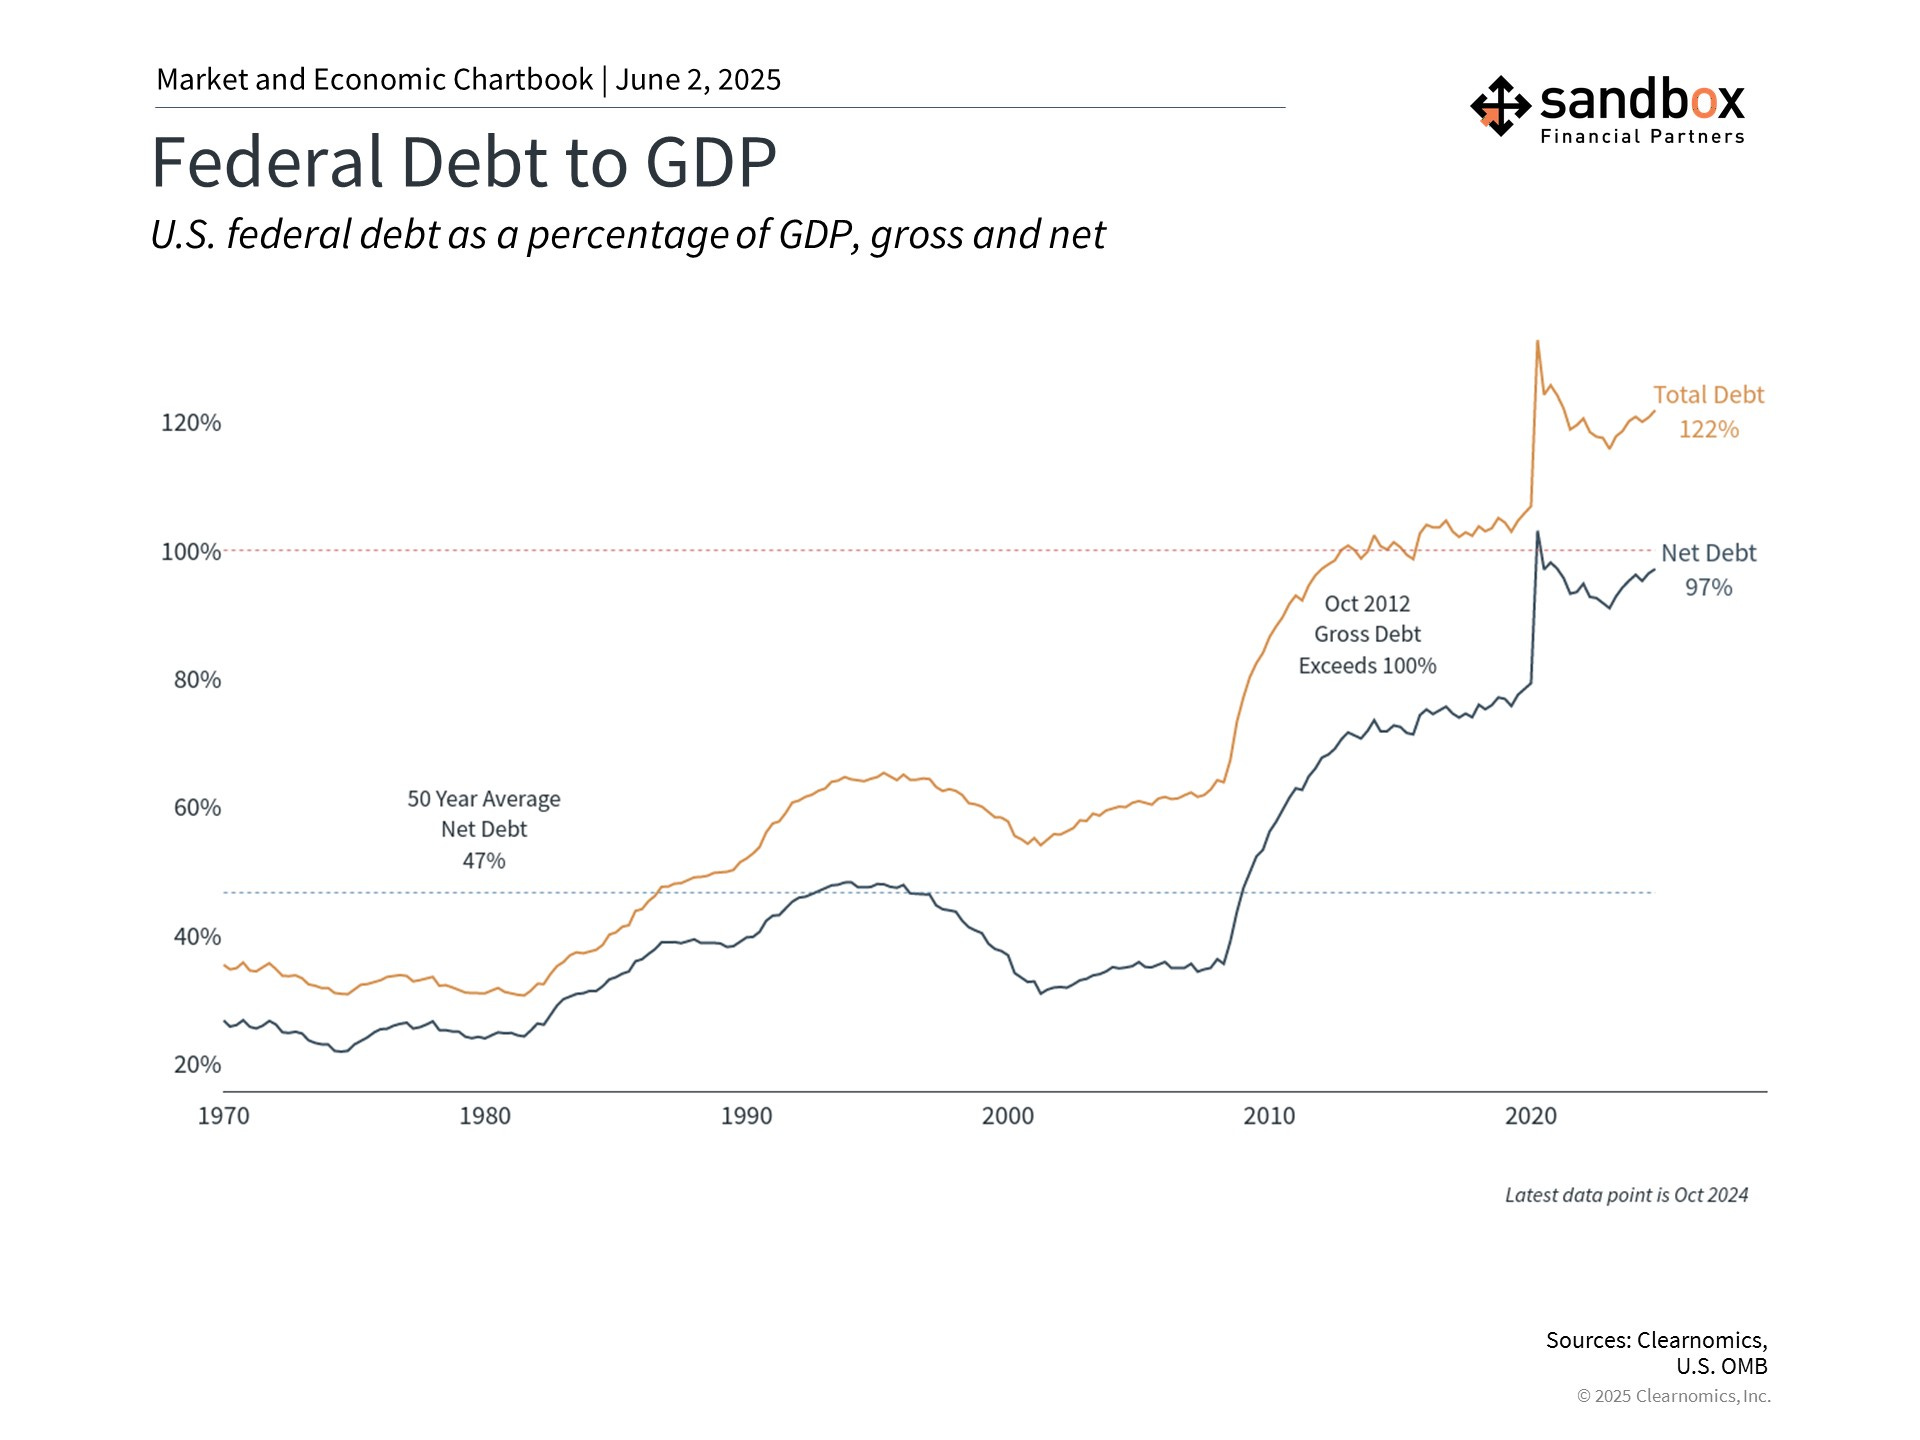
Moody's downgrade the U.S. credit rating
The United States lost its last perfect credit rating, with Moody’s downgrading the U.S.’ sovereign credit rating one notch from Aaa to Aa1. This followed previous downgrades by Fitch in 2023 and Standard & Poor's in 2011 which all reflect concerns about the nation's growing debt and spending.
The chart below shows that the U.S. total debt grew to 122% of GDP in 2024. Net debt, which excludes debt the government owes itself, has risen to 97%.
Despite the historic nature of the U.S. debt downgrade, markets hardly reacted. This is because the downgrade is mostly backward-looking and investors are already familiar with the nation's fiscal challenges.
Perhaps it was not a coincidence that this downgrade occurred as the House of Representatives was passing a comprehensive tax and spending bill. The approved bill would extend the individual tax cuts from the Tax Cuts and Jobs Act. According to the Penn Wharton Budget Model, the legislation could increase deficits by $2.8 trillion over the next 10 years.
Trade negotiations show progress
We saw some progress on trade negotiations in May, taking many of the worst-case scenarios off the table.
The administration reached its first agreement with the United Kingdom, while negotiations continued with other major trading partners. The U.S.-China trade agreement included a 90-day period of reduced U.S. tariffs on Chinese goods.
Despite these deals, there will likely continue to be uncertainty around trade.
More recently, China and the U.S. have both accused each other of violating the trade truce, and the administration wants higher tariffs on steel and aluminum. At the same time, negotiations with the European Union produced optimism when the White House delayed its scheduled 50% EU tariff after positive discussions. This suggests that diplomatic solutions remain possible, even when initial positions appear far apart.
The administration is also facing legal challenges to its tariffs. In May, the U.S. Court of International Trade struck down many of the newly enacted tariffs, ruling that they exceed presidential power under the International Economic Emergency Powers Act. While a federal appeals court paused the ruling, allowing tariffs to remain in place for now, this legal challenge adds another layer of uncertainty to the trade landscape.
It is important to remember that trade policy typically unfolds over months and years rather than days or weeks.

Volatility is mean reverting
Volatility is mean-reverting in nature, particularly at extremes.
This means extreme spikes in stock market volatility – like those experienced during sharp market corrections, such as Liberation Day – are typically followed by periods of normalization as uncertainty fades and investor sentiment stabilizes.
When volatility is elevated, it often reflects panic or rapid repricing of downside risks, conditions that are unsustainable over long periods.
As markets digest new information and risk appetite returns, volatility contracts toward historical norms, restoring a more typical trading environment.
The April and May period are a sterling example of how volatility expands and contracts around new information, investor behavior, and market positioning.
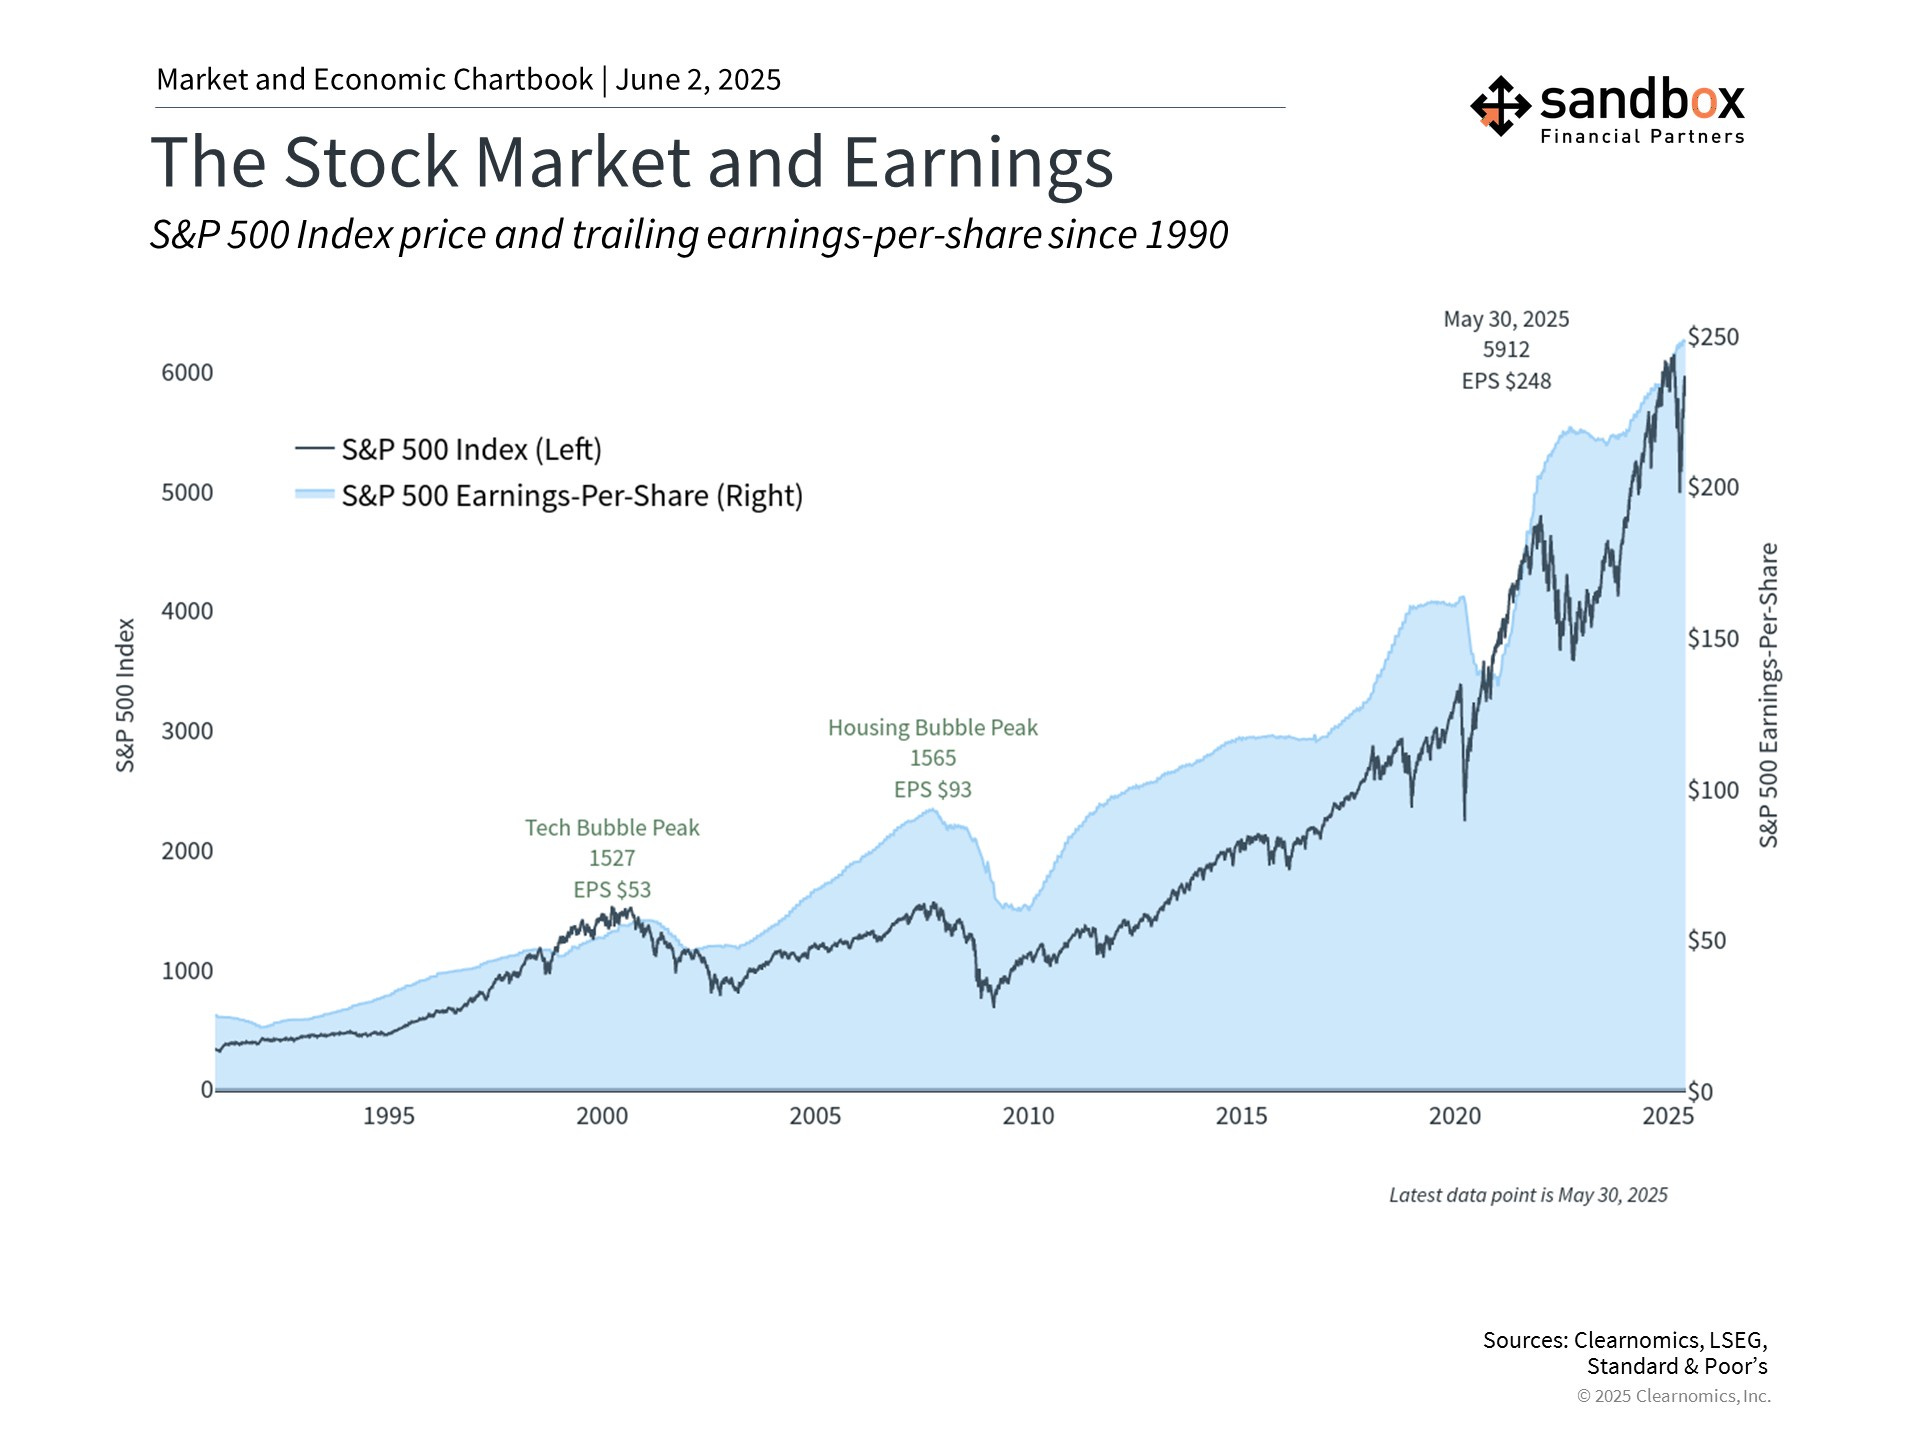
Steady earnings growth supports market
First quarter corporate earnings reports presented another reason for optimism. S&P 500 companies delivered a very healthy +13.4% year-on-year earnings growth in Q1.
This strong earnings performance highlighted the underlying health of corporate profitability heading into the trade wars episode, with technology companies showing resilience as they navigate trade uncertainty.
In contrast, consumers have been pessimistic this year due to tariffs and inflation concerns. However, recent sentiment indicators began showing signs of improvement that align more closely with positive earnings and economic data. The University of Michigan's most recent survey for May showed inflation expectations decreasing slightly and sentiment stabilizing.
While it's important not to read too much into a single month's data, this improvement represents an encouraging development.
Bottom line?
May was a positive month for investors.
While the U.S. debt downgrade and fiscal concerns created new challenges, progress on trade deals helped to boost markets.
Sources: Ryan Detrick, Clearnomics, Apricitas Economics, YCharts
That’s all for today.
Blake
Questions about your financial goals or future?
Connect with a Sandbox financial advisor – our team is here to support you every step of the way!
Welcome to The Sandbox Daily, a daily curation of relevant research at the intersection of markets, economics, and lifestyle. We are committed to delivering high-quality and timely content to help investors make sense of capital markets.
Blake Millard is the Director of Investments at Sandbox Financial Partners, a Registered Investment Advisor. All opinions expressed here are solely his opinion and do not express or reflect the opinion of Sandbox Financial Partners. This Substack channel is for informational purposes only and should not be construed as investment advice. The information and opinions provided within should not be taken as specific advice on the merits of any investment decision by the reader. Investors should conduct their own due diligence regarding the prospects of any security discussed herein based on such investors’ own review of publicly available information. Clients of Sandbox Financial Partners may maintain positions in the markets, indexes, corporations, and/or securities discussed within The Sandbox Daily. Any projections, market outlooks, or estimates stated here are forward looking statements and are inherently unreliable; they are based upon certain assumptions and should not be construed to be indicative of the actual events that will occur.
Please see additional disclosures (click here)
Please see our SEC Registered firm brochure (click here)
Please see our SEC Registered Form CRS (click here)