

Stocks navigate choppy water early in 2025
The Sandbox Daily (2.4.2025)

Welcome, Sandbox friends.
Today’s Daily discusses:
February seasonality
Let’s dig in.
Blake
Markets in review
EQUITIES: Russell 2000 +1.41% | Nasdaq 100 +1.26% | S&P 500 +0.72% | Dow +0.30%
FIXED INCOME: Barclays Agg Bond +0.19% | High Yield +0.32% | 2yr UST 4.218% | 10yr UST 4.517%
COMMODITIES: Brent Crude -0.01% to $75.95/barrel. Gold +0.66% to $2,852.6/oz.
BITCOIN: -3.17% to $97,972
US DOLLAR INDEX: -0.94% to 107.967
CBOE TOTAL PUT/CALL RATIO: 0.93
VIX: -7.57% to 17.21
Quote of the day
“The fight is won or lost far away from the witnesses – behind the lines, in the gym, and out there on the road – long before I dance under those lights.”
- Muhammad Ali
Stocks work through early weakness
After a slow start out of the gate, stocks hit their stride in the back half of January as the major averages pushed back towards all-time highs and breadth showed meaningful technical progress.
Then, we had a DeepSeek weekend followed by a tariff weekend, which reminded investors that market risk is always lurking around the corner and pullbacks are customary.
In fact… the stock market is supposed to fall every once in a while! It can’t just keep going up forever. Drawdowns are perfectly normal.
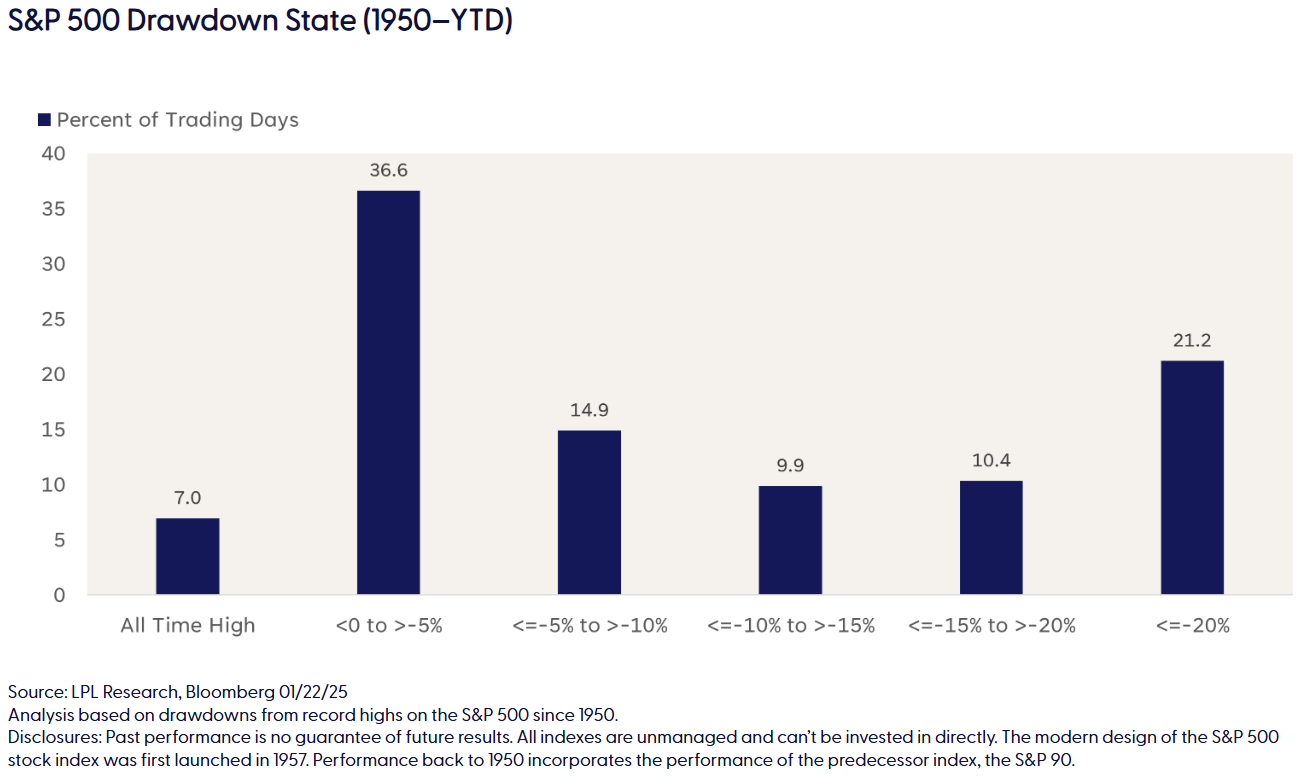
Over the last 100 years or so, the market has averaged a 3% dip (or greater) seven times each year, while experiencing a mild correction of 5% (or more) three-to-four times each year.

Because of these ebbs and flows, we know the market is often trading in a drawdown of some form or fashion.
The most frequent – specifically in the years since the Global Financial Crisis – are shallow drawdowns where the index trades within 5% of an all-time high, occurring one third of post-war market history.
And yet, President Trump’s pro-growth agenda, a reprieve from rising rates, solid earnings, and another buy-the-dip rebound have equity markets brushing off these recent headline risks.
Looking ahead, what should investors expect over the near-term for stocks?
Unfortunately, February is one of the weakest months on the calendar, historically speaking.
The chart below shows the average monthly performance of the S&P 500 index since 1928, which has generated an average return of -0.1% and finished the month in positive territory just 53% of the time (51 of 97 years).
When returns were positive during the month, they historically averaged +2.9%. Conversely, the S&P 500 declined an average of -3.4% when February was down.

Early bouts of weakness in January and February would align with the first year progression of the Presidential Cycle which has historically demonstrated softness in the early months of the new administration.
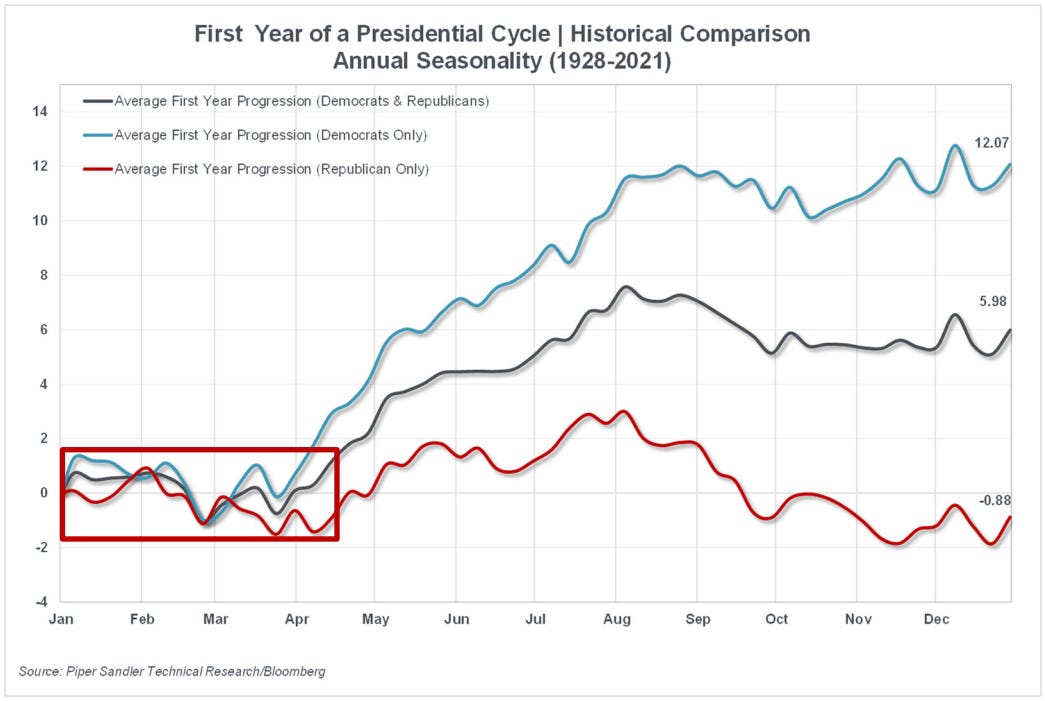
February for inauguration years has been a volatile month for stocks, with an average loss of -1.6%.

If these early days are any indication, volatility could remain fairly constant throughout 2025 as the economy works through an uncertain political climate, tariff overtures, year three of a bull market, and a stock market that’s fully valued.
Sources: Ned Davis Research, LPL Financial, Piper Sandler
That’s all for today.
Blake
Questions about your financial goals or future?
Connect with a Sandbox financial advisor – our team is here to support you every step of the way!
Welcome to The Sandbox Daily, a daily curation of relevant research at the intersection of markets, economics, and lifestyle. We are committed to delivering high-quality and timely content to help investors make sense of capital markets.
Blake Millard is the Director of Investments at Sandbox Financial Partners, a Registered Investment Advisor. All opinions expressed here are solely his opinion and do not express or reflect the opinion of Sandbox Financial Partners. This Substack channel is for informational purposes only and should not be construed as investment advice. The information and opinions provided within should not be taken as specific advice on the merits of any investment decision by the reader. Investors should conduct their own due diligence regarding the prospects of any security discussed herein based on such investors’ own review of publicly available information. Clients of Sandbox Financial Partners may maintain positions in the markets, indexes, corporations, and/or securities discussed within The Sandbox Daily. Any projections, market outlooks, or estimates stated here are forward looking statements and are inherently unreliable; they are based upon certain assumptions and should not be construed to be indicative of the actual events that will occur.
Please see additional disclosures at the Sandbox Financial Partners website: